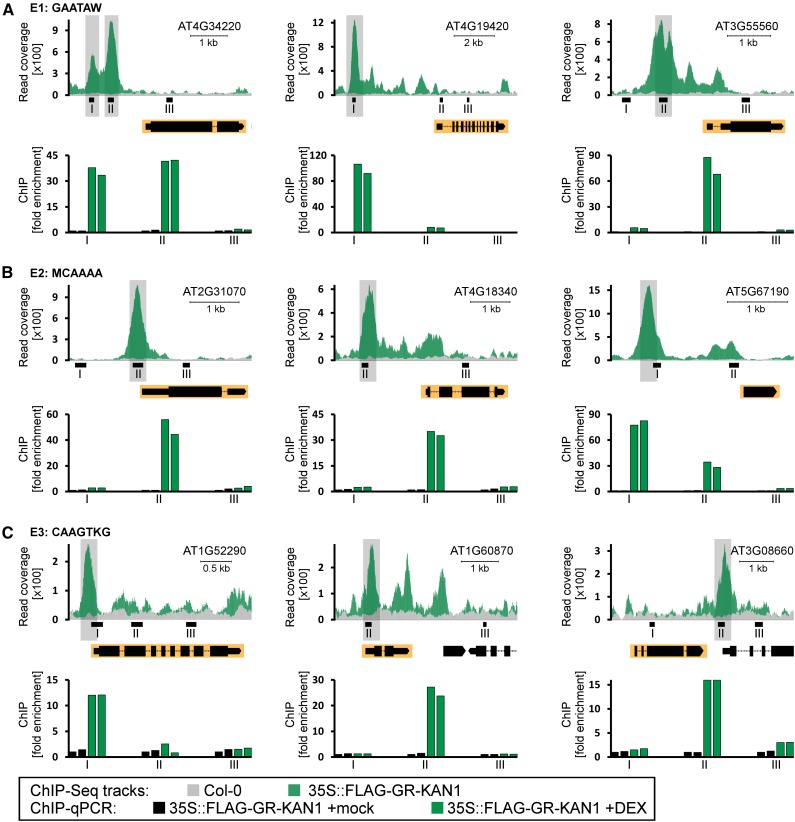
Figure 4.
Validation of KAN1 interacting with the E1, E2, and E3 elements of selected target genes. ChIP-qPCR analysis is shown for three KAN1 targets with the E1 element (GAATAW) in the promoter (A), three KAN1 targets with the E2-binding site (MCAAAA) in the proximal promoter (B), and three KAN1 targets with the E3 element (CAAGTKG) in the proximal promoter (C). Top rows depict the read coverage of the respective transcription units obtained from ChIP-Seq of Col-0 (gray) and 35S::FLAG-GR-KAN1 (green) plants. Gene models are shown under the ChIP-Seq tracks, and respective genes have a yellow background. Shaded peaks harbor the respective elements. Bottom rows show ChIP-qPCR experiments with two biological replicates for 35S::FLAG-GR-KAN1 plants that were mock treated (black bars) and 35S::FLAG-GR-KAN1 plants treated with DEX (green bars). Each genomic region was tested with three primer pairs (I–III). Primer pairs not present in the read coverage plots are located outside the depicted region. The y axis shows the fold enrichment normalized to the mock-treated immunoprecipitates.

