Figure 4.
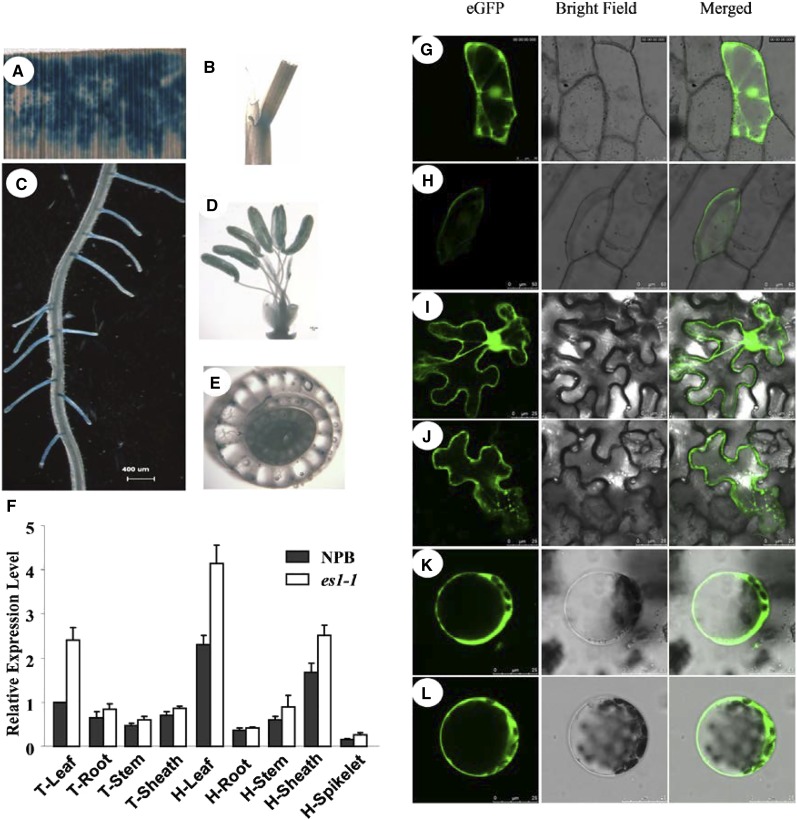
Expression of ES1 and subcellular localization of ES1. A to E, GUS staining of leaf (A), leaf sheath (B), fibrous root (C), stamen (D), and culm vascular bundles (E). F, Quantitative real-time PCR analysis of ES1 expression in different tissues at the tillering stage (T) and the heading stage (H). The results are given as means of three independent assays, and each error bar represents the percentage sd of the mean. G to L, GFP fluorescence visualized by confocal microscopy. G and H, Transient expression of eGFP (G) and eGFP-ES1 cDNA (H) in epidermal cells of onion. 35S::eGFP-ES1 cDNA and 35S::GFP were transiently expressed in onion epidermal cells. I to L, Transient expression of eGFP in epidermal cells (I) and protoplasts (K) and expression of eGFP-ES1 in epidermal cells (J) and protoplasts (L) of Nicotiana benthamiana leaves. 35S::eGFP-ES1 and 35S::GFP were transiently expressed in N. benthamiana leaves.

