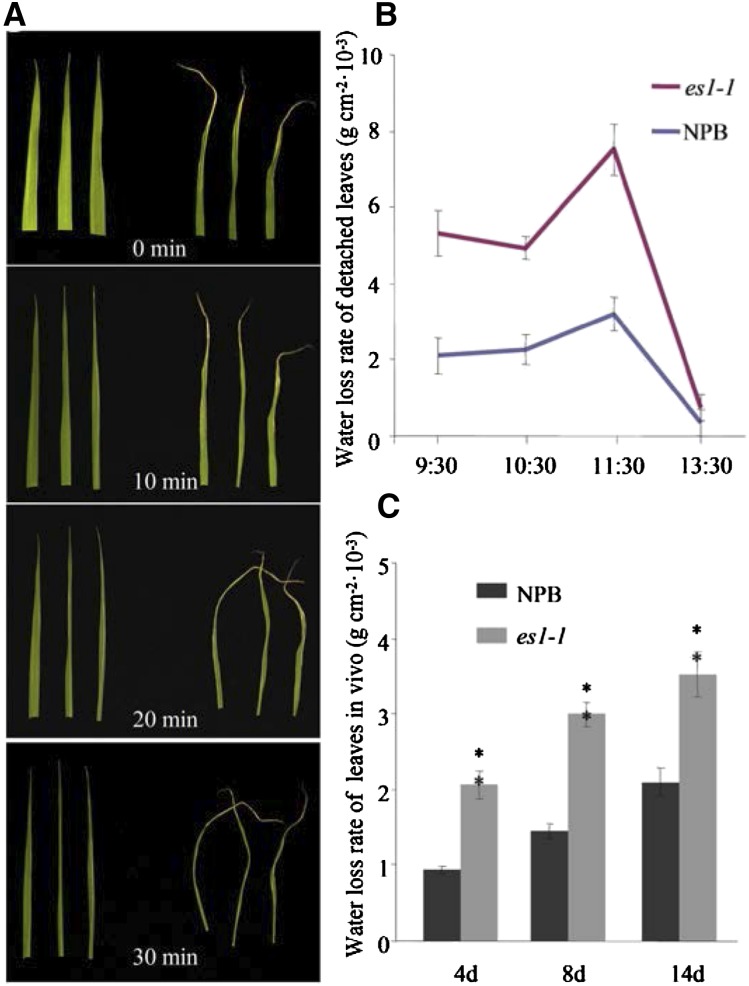
Figure 6.
Observation of water loss rate between wild-type and es1-1 plants. A, Water loss rate of detached leaves at the seedling stage (left, cv NPB; right, es1-1). B, Water loss rate of detached leaves at the tillering stage. C, Water loss rate per unit of time of living leaves between cv NPB and es1-1 plants at the tillering stage. Error bars indicate sd (n = 15). Asterisks indicate the significance of differences between cv NPB and es1-1 plants, as determined by Student’s t test: *, 0.01 ≤ P < 0.05 and **, P < 0.01.

