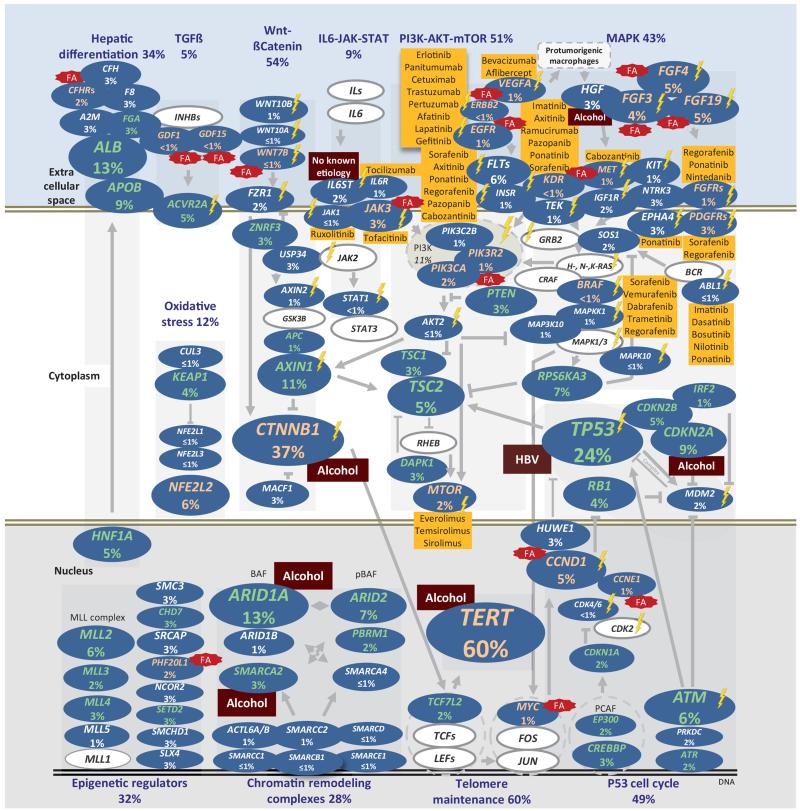
Figure 3.
The landscape of altered genes and pathways in HCC. Eleven pathways altered in ≥5% of HCC. Genes belonging to each pathway are represented with their alteration frequencies (green font: inactivation; red font: activation; white font: unknown) and activating or inhibiting interactions between pathways are highlighted. Major genes lacking alterations are highlighted in white. Focal amplifications (FA) and significant associations with etiologies are indicated. Potential druggable genes are assigned (yellow: FDA-approved drugs; lighting: drugs screened in phase I-III clinical trials).

