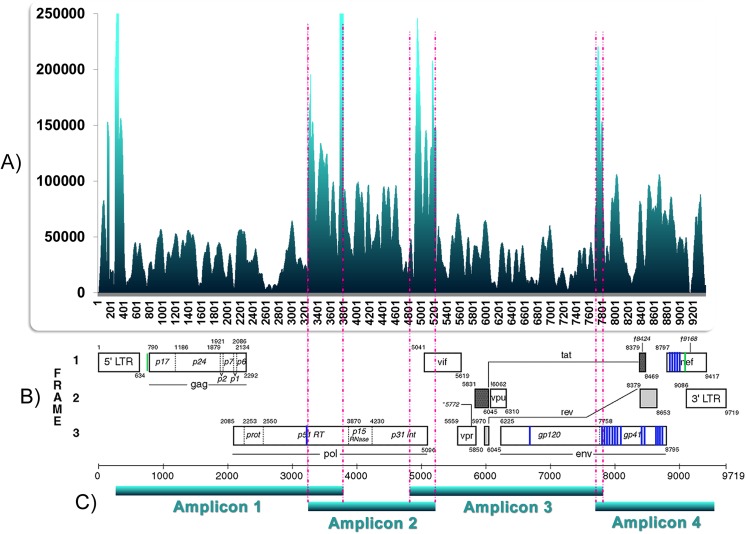
Fig 3. Depth coverage of SOLiD sequencing per nucleotide position, observed nucleotide changes per position and amplification strategy.
A) X axis indicates positions along the HIV-1 genome and Y axis the number of times each position was sequenced. Shown here the sequence depth coverage obtained from stimulated purified CD4 positive cells infected by R5 pseudotyped virus. B) Nucleotide changes affecting the majority of sequences from the proviral population. Data obtained from non-stimulated purified CD4 positive cells infected with X4 pseudotyped HIV-1 after a single round of reverse transcription. Diagrammatical location of changes: blue lines = mutated positions; green lines = boundaries of the investigated region. C) Amplification strategy was performed with 4 overlapping sub-genome fragments (A,B,C,D).

