
Figure 3. Input–output relationship of LC-NE neurons revealed by TRIO and cTRIO.
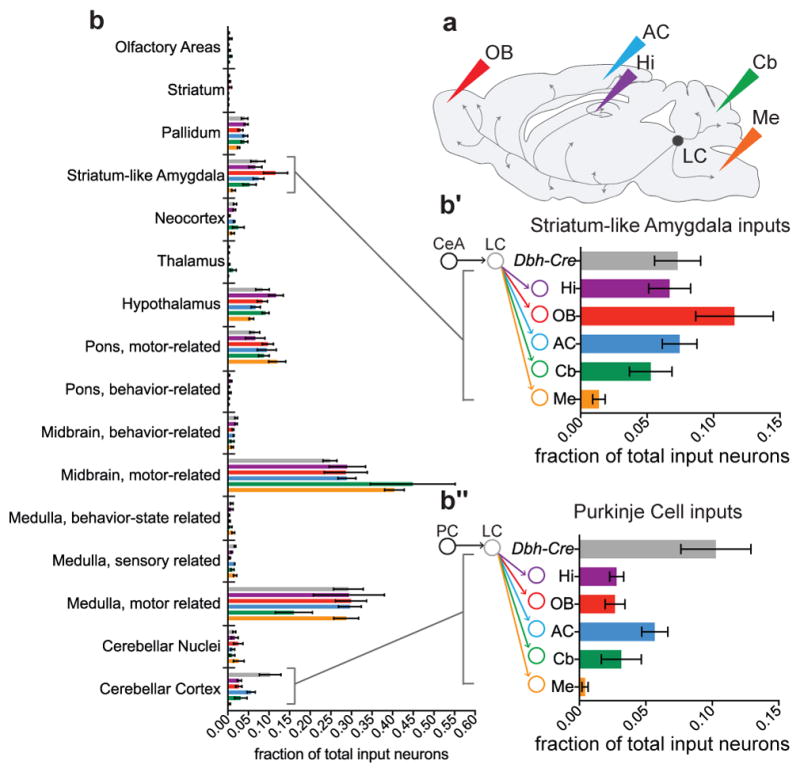
a, Schematic of CAV injections into LC output regions for TRIO and cTRIO. OB, olfactory bulb; AC, auditory cortex; Hi, hippocampus; Cb, cerebellum; Me, medulla. b, Average fractional inputs in Dbh-Cre-based input tracing (gray, n=9), TRIO (Hi, purple; OB, red; AC, blue; n=4 each), and cTRIO (Cb, green; Me, orange; n=4 each). Input neurons were grouped into 16 broader categories. Magnified insets highlight the average fraction of input from striatum-like amygdala (>98% from the central amygdala) (b′) or from Purkinje cells (b″) to LC-NE neurons that project to the 5 output regions or in Dbh-Cre-based input tracing. Error bars, s.e.m.