
Fig. 1.
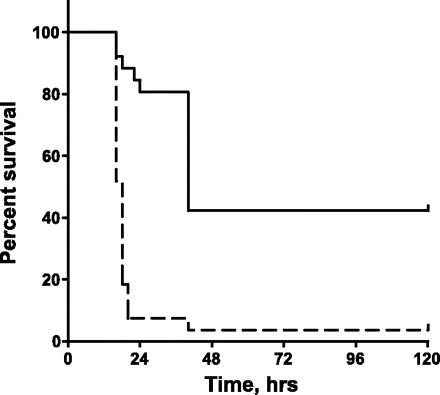
B6;129E2F1−/− mice (dashed line) are more sensitive than B6x129 F2 controls (solid line) to systemic LPS challenge (n = 27 in each group). Curve comparison was performed using the Mantel-Cox log-rank test implemented in GraphPad Prism (P < 0.0001).