
Fig. 6.
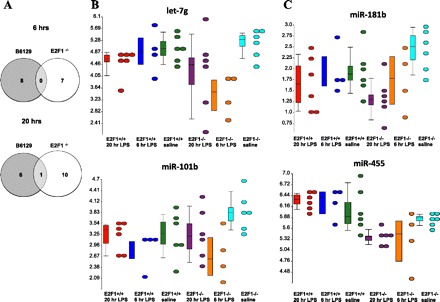
miRNA profiles of liver tissue of mice treated with LPS or saline systemically for 6 or 20 h. A: Venn diagrams depicting differentially expressed miRNAs in B6;129E2F1−/− and B6x129 F2 mice in response to LPS, as determined by SAM (1% FDR; 924 unique permutations). Similar numbers of miRNAs are differentially expressed in B6;129E2F1−/− and B6x129 F2 control mice both 6 and 20 h post-LPS with minimal overlap of miRNA expression profiles in the 2 strains of mice. B: dot plots illustrating expression levels of let-7g and miR-101b, two of the miRNAs differentially expressed in B6;129E2F1−/− but not B6x129 F2 mice 6 h post-LPS. C: dot plots illustrating expression levels of miR-181b and miR-455, two of the miRNAs differentially expressed in B6;129E2F1−/− but not B6x129 F2 mice 20 h post-LPS. Color scheme for B and C: red, B6x129 F2 20 h LPS; blue, B6x129 F2 6 h LPS; green, B6x129 F2 saline; purple, B6;129E2F1−/− 20 h LPS,; orange, B6;129E2F1−/− 6 h LPS; cyan, B6;129E2F1−/− saline.