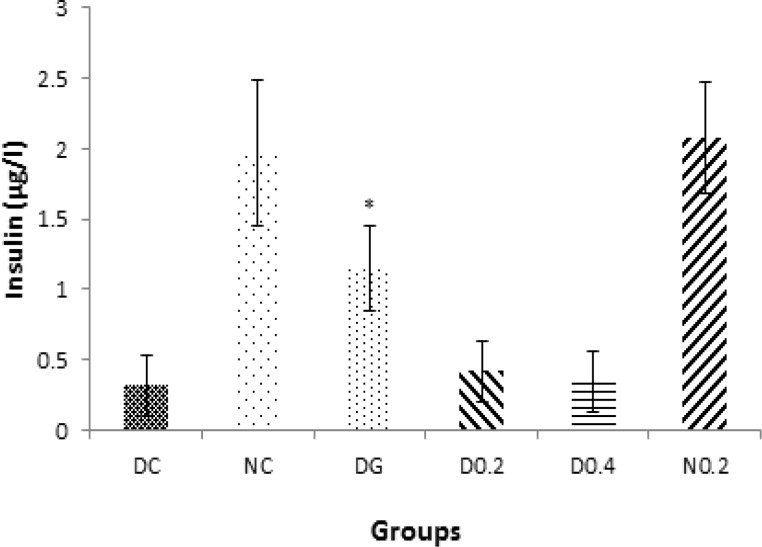
Figure 3.
Levels of serum insulin through week 1 to 5. Data are expressed as mean±SD of measurements from 6 rats. Groups are labelled as follows: NC: normal control, DC: diabetic control, DG: diabetic rats treated with glybencelamide, D0.2 and D0.4: diabetic rats treated with 0.2 and 0.4 g/kg of hydro-alcoholic extract of the C. spinosa root, and N0.2: normal control treated with 0.2 g/kg plant extract. *: p˂0.05 in comparison with DC.

