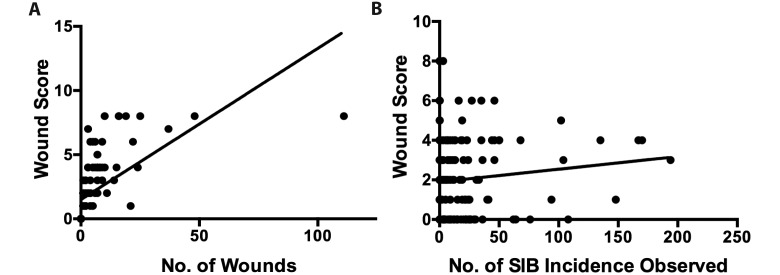
Figure 2.
(A) Wound score correlates with the total number of wounds at each time point (P < 0.0005; z score, 8.38). (B) Wound score correlates with the incidence of observed SIB (P = 0.008; z score, 2.63). The graphical representations in panels A and B do not display the variable of time, the third dimension of the statistical analysis performed.

