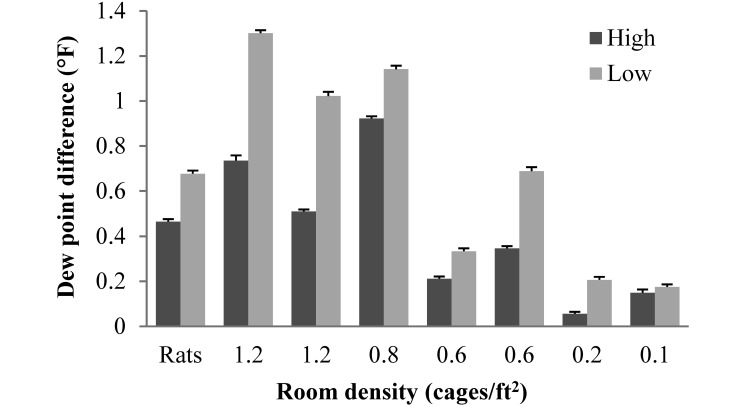
Figure 2.
Difference in dew point temperature (°F) between the room and the supply air at the 2 ventilation rates (low, 5 to 6 ACH; high, 10 to 12 ACH) for each room, indicated as those housing rats (0.5 cages/ ft2) or as number of mouse cages per ft2 of floor space. Data are presented as mean ± SEM. Except for the room with 0.1 cages/ft2, dew point temperature differed significantly (P < 0.0001) between the 2 ventilation rates in all rooms.

