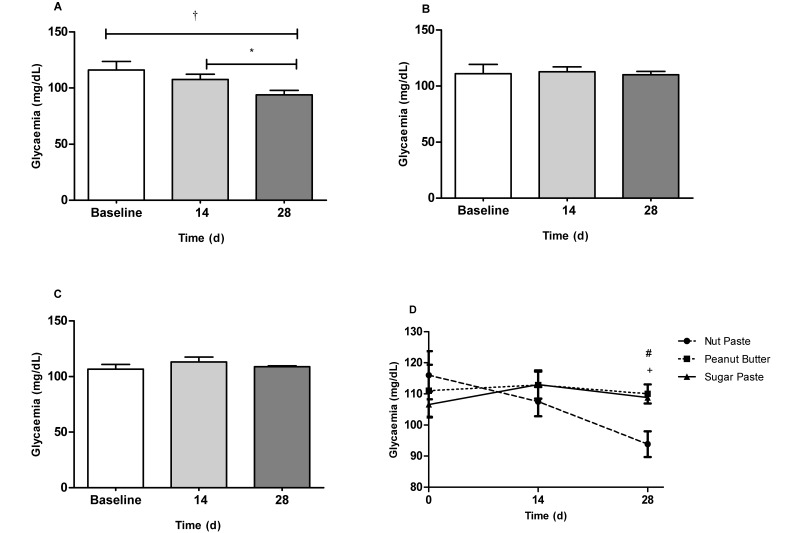
Figure 2.
Blood glucose values (mg/dL) in the serum of Wistar rats fed 0.5 g of (A) nut paste, (B) peanut butter, or (C) sugar paste. (D) Comparison of the effects of the 3 vehicles on glycemia at the 14- and 28-d time points. Data are expressed as mean ± SEM; n = 6 for all groups. *, P < 0.05; †, P < 0.01 according to one-way ANOVA with the Bonferroni multiple-comparison test. #, P < 0.05 (nut paste compared with sugar paste); +, P < 0.01 (nut paste compared with peanut butter) according to one-way ANOVA with the Tukey multiple-comparison test.

