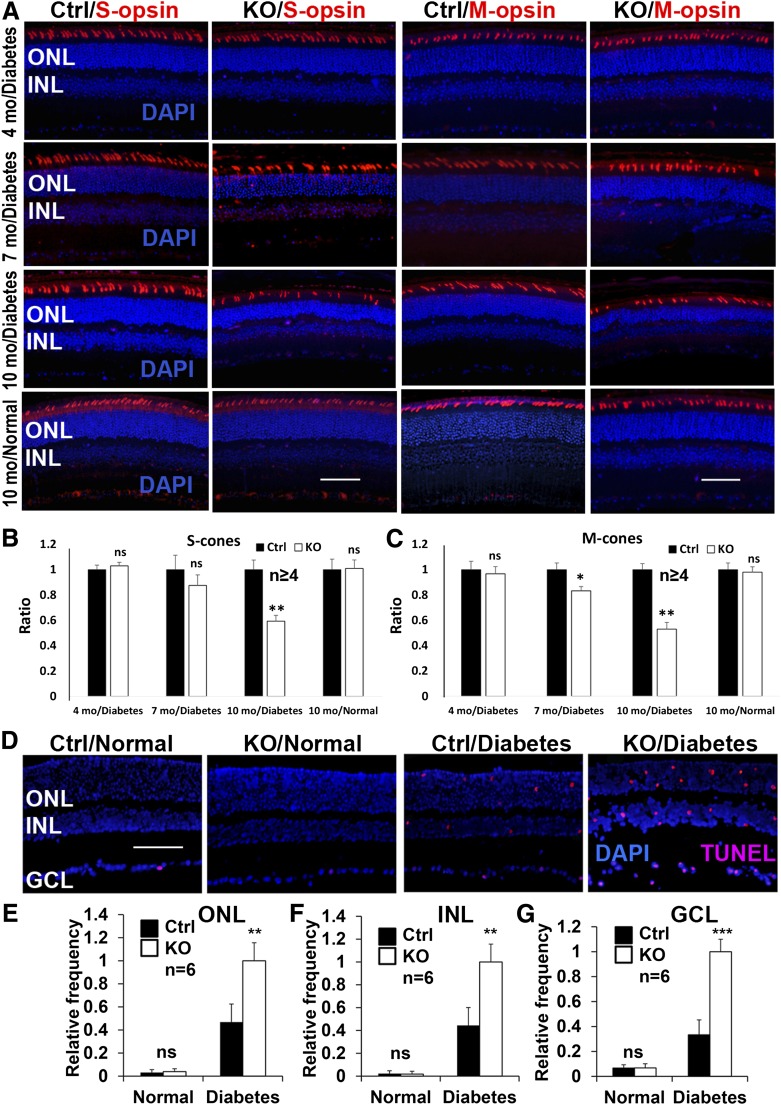
Figure 5.
IHC analysis of cone cell density and retinal apoptosis in diabetic conditional Vegfr2 KO mice. A–C: Representative IHC images (A) and statistical analysis (B and C) for diabetes-induced loss of S- and M-opsin–expressing cone cells in Vegfr2 KO mice (n = 6 for 10-month diabetes group; n ≥ 4 for other groups). Representative images (D) and analysis of diabetes-elevated TUNEL-positive cells in ONL (E), INL (F), and GCL (G) in conditional Vegfr2 KO mice 4 months after STZ injection (n = 6). Error bar: SD. Ctrl, control; mo, month; ns, not significant. *P < 0.05; **P < 0.01; ***P < 0.001.

