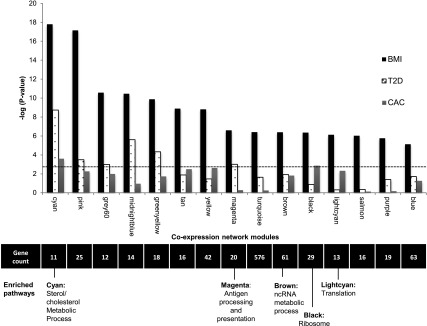
Figure 2.

Gene coexpression network modules identified associating with BMI. Significance (−log10 P value on the y-axis) resulting from the association of each consensus network module of coexpressed genes (eigengene) with BMI, T2D, and CAC in 1,264 monocyte samples; dashed line represents a Bonferroni correction for 15 modules (α = 0.05). The number of genes and the biological pathways significantly enriched within each module (from DAVID, FDR <0.05) are also shown below, corresponding to each coexpression network module (x-axis). See also Supplementary Tables 4 and 5. ncRNA, noncoding RNA.
