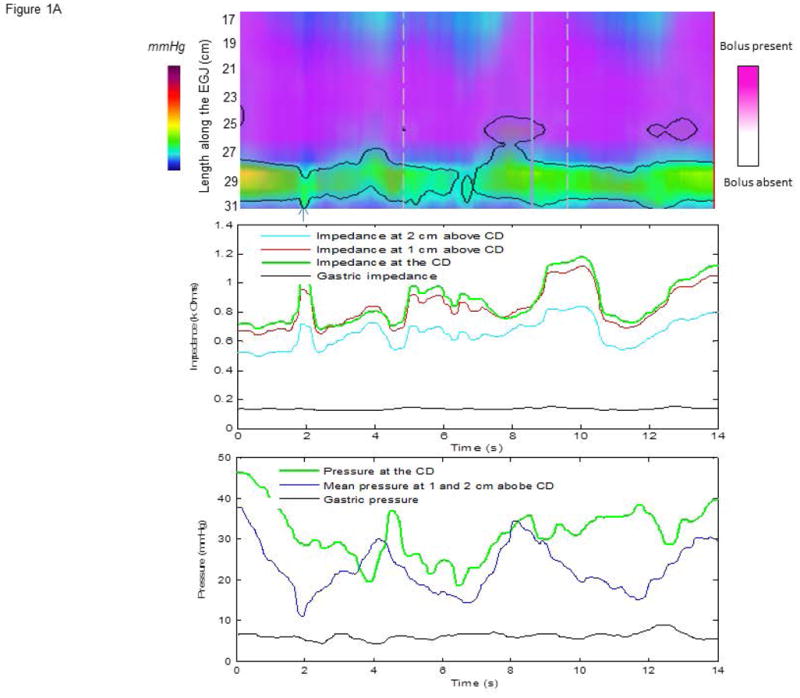
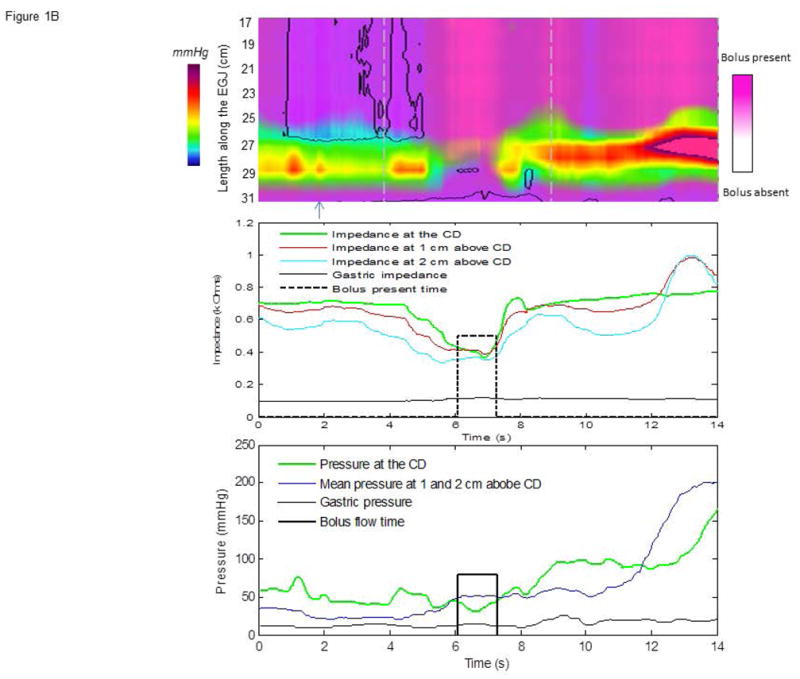
Figure 1.


Examples of: (A) type I achalasia with a BFT of zero and (B) type II achalasia with a BFT of 1.25 s. The top panels show the EPT plot with overlying impedance topography. In Figure 1A, there is no period of 50% drop in impedance (middle panel) and no period of relaxation to <15 mmHg (bottom panel, crural diaphragm (CD) line). This suggests poor relaxation and no opening. There are limited time periods during which the mean pressure above the CD (bottom panel, blue pink line) exceeds pressure at the crural diaphragm (green line) suggesting a flow-permissive gradient. However, since both impedance and manometric criteria are requisite, the BFT is 0. In Figure 1B (middle panel) there is a 50% drop in each impedance recording suggesting EGJ opening. The BFT algorithm defines the onset of opening as the time at which the impedance drop achieves 90% of its nadir value at all three impedance loci and the offset as return to the 50% point indicated by the black dashed line. In the lower panel, a preferential flow gradient is noted when mean pressure above the CD (blue line) are greater than the CD (green line) and gastric pressure (black line). The solid black line indicates the interval that all BFT criteria are met, totaling 1.25 s in this case.
