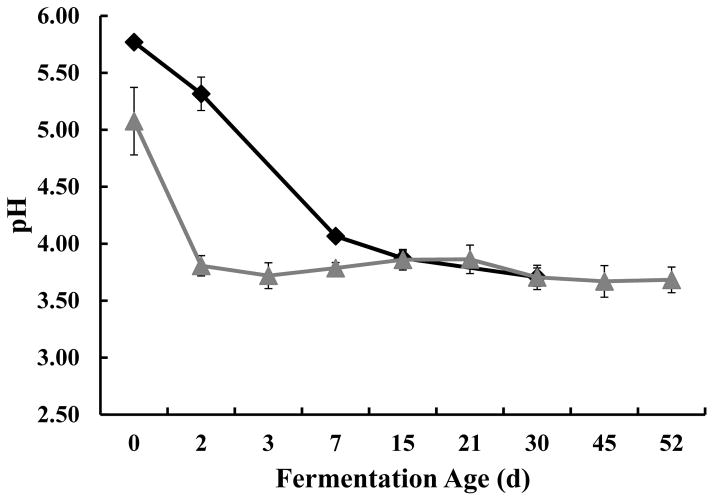
Figure 5.
Changes of pH during yacon fermentation. Numbers presented for the cover brine samples (
 ) are the averages of triplicate from two independent replicates. Numbers presented for the brined yacon samples (◆) represent triplicates of one lot of yacon with corresponding standard deviations. The fermentation age axis is not drawn to scale.

