
Fig 5. Plaque2.0 scores infection phenotypes in high throughput mode.
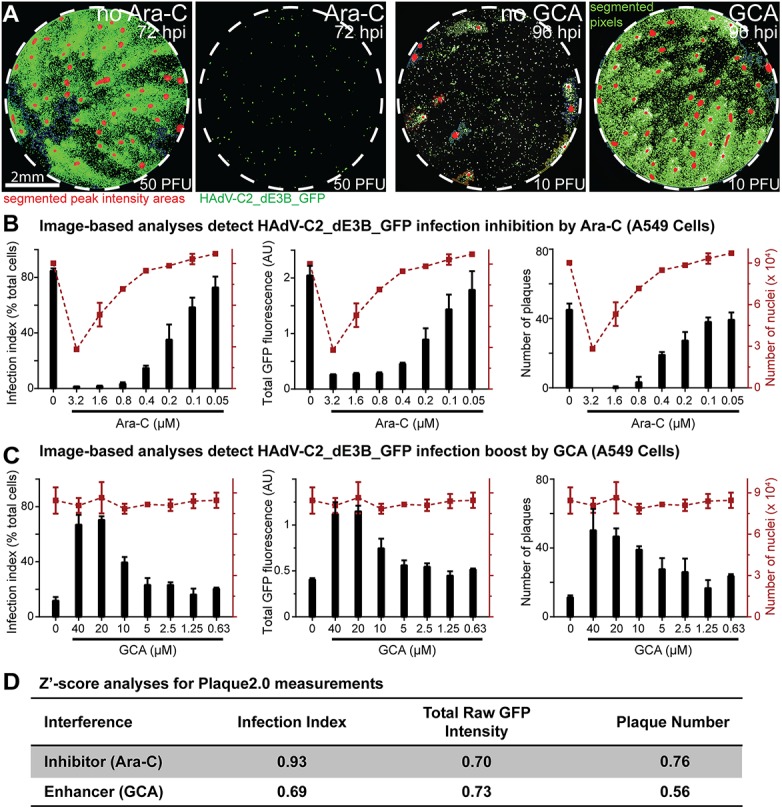
(A) Effects of Ara-C (3.2 μM) and GCA (40 μM) on HAdV-C2_dE3B_GFP plaque formation in A549 cells 2 days pi with low MOI of 50 or 10 PFU per 96 well dish, respectively. Green signals designate infected cells (GFP), and red signals highlight local GFP maxima indicative of the center of the respective plaques. (B, C) Plaque2.0 scored HAdV-C2_dE3_GFP infection index, total GFP fluorescence and plaque numbers in A549 cells treated with Ara-C (B) or GCA (C). Red dotted lines represent the number of nuclei in the respective 96 wells. Results are represented as mean values from two technical replicas, and error bars represent the standard deviations of the respective means. (D) Z’-score analyses for Plaque2.0 assay of Ara-C (0.4 μM) or GCA (40 μM) tuned HAdV-C2_dE3B_GFP infections.