
Fig. 4.
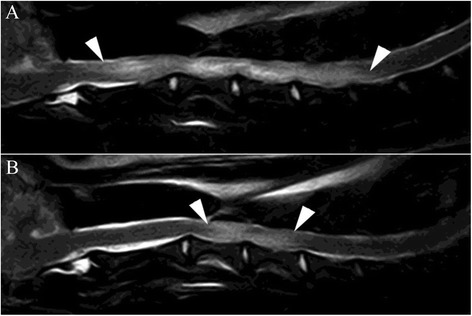
Sagittal T2 (FSE T2, TR 4710 TE 120; 3-mm slice thickness) through the cervical spine. a Before and b 40 days after initiation of therapy. a shows increased intramedullary signal from mid of C2 until mid of C6 (arrowheads). The changes are consistent with inflammatory edema. b The visible extent of the inflammation is significantly decreased—changes reach now from mid of C3 to the end of C4 (arrowheads)