Figure 1.
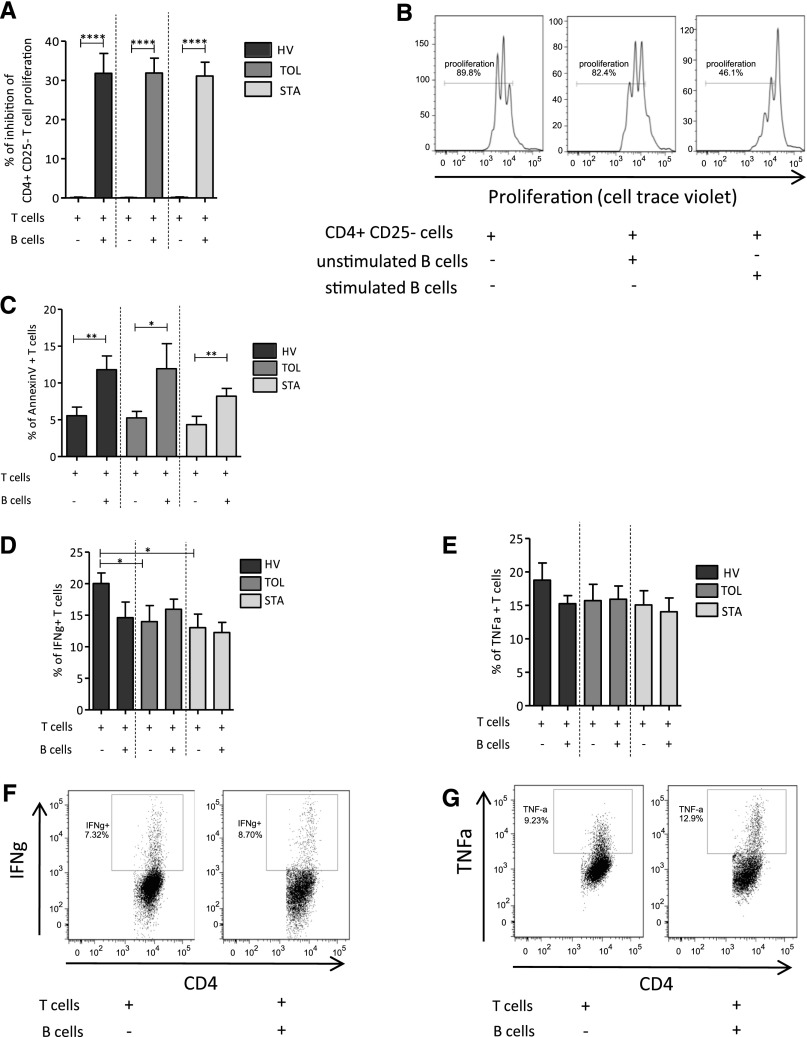
CpG-CD40 prestimulated B cells inhibit CD4+CD25− T cell proliferation and induce T cell apoptosis without effect on type Th1 proinflammatory cytokine production. Effector T cell proliferation is followed by CellTrace Violet staining after 3 days activated with anti-CD3/anti-CD28 and cocultured with unstimulated B cells or B cells stimulated with CD40L and ODN 24 hours before the coculture. (A) Proportion of T cell proliferation inhibition when cocultured with or without prestimulated B cells in HVs (n=17), TOLs (n=12), and STAs (n=17) (mean±SEM; ****P<0.001). (B) Representative histograms of proliferation of T cells: alone, with unstimulated B cells, and with stimulated B cells from HVs. Apoptosis of effectors T cells is analyzed by Annexin V staining after 3 days of activation with anti-CD3/anti-CD28 and coculture with B cells prestimulated with CD40L and ODN 24 hours before the coculture. (C) Percentage of Annexin V T cells activated and cocultured with or without stimulated B cells in HVs (n=9), TOLs (n=10), and STAs (n=12) (mean±SEM; *P<0.05; **P<0.01). Secretion of IFN-γ and TNF-α is analyzed by intracellular staining in effector T cells after 3 days of coculture with B cells and anti-CD3/anti-CD28 activation. (D) Percentage of IFN-γ+ T cells activated and cocultured with or without B cells in HVs (n=17), TOLs (n=12), and STAs (n=14) (mean±SEM; *P<0.05). (E) Percentage of TNF-α+ T cells activated and cocultured with or without B cells in HVs (n=17), TOLs (n=12), and STAs (n=14) (mean±SEM). (F and G) Representative dot plots of the secretion of IFN-γ and TNF-α by T cells activated and cocultured with or without B cells from HVs.

