Figure 3.
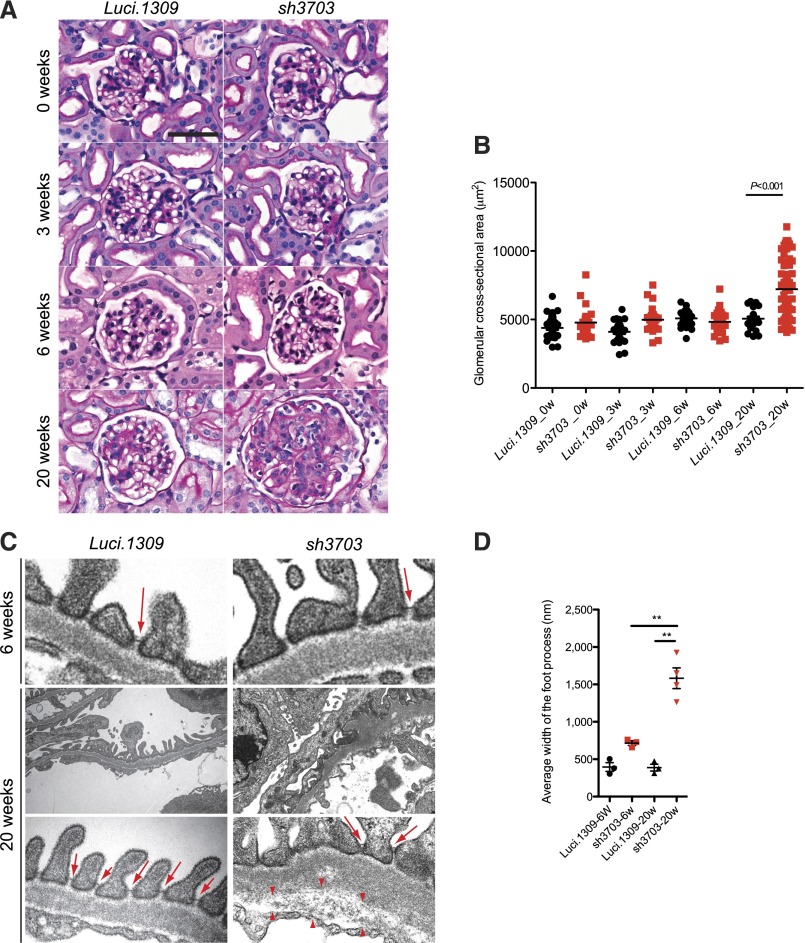
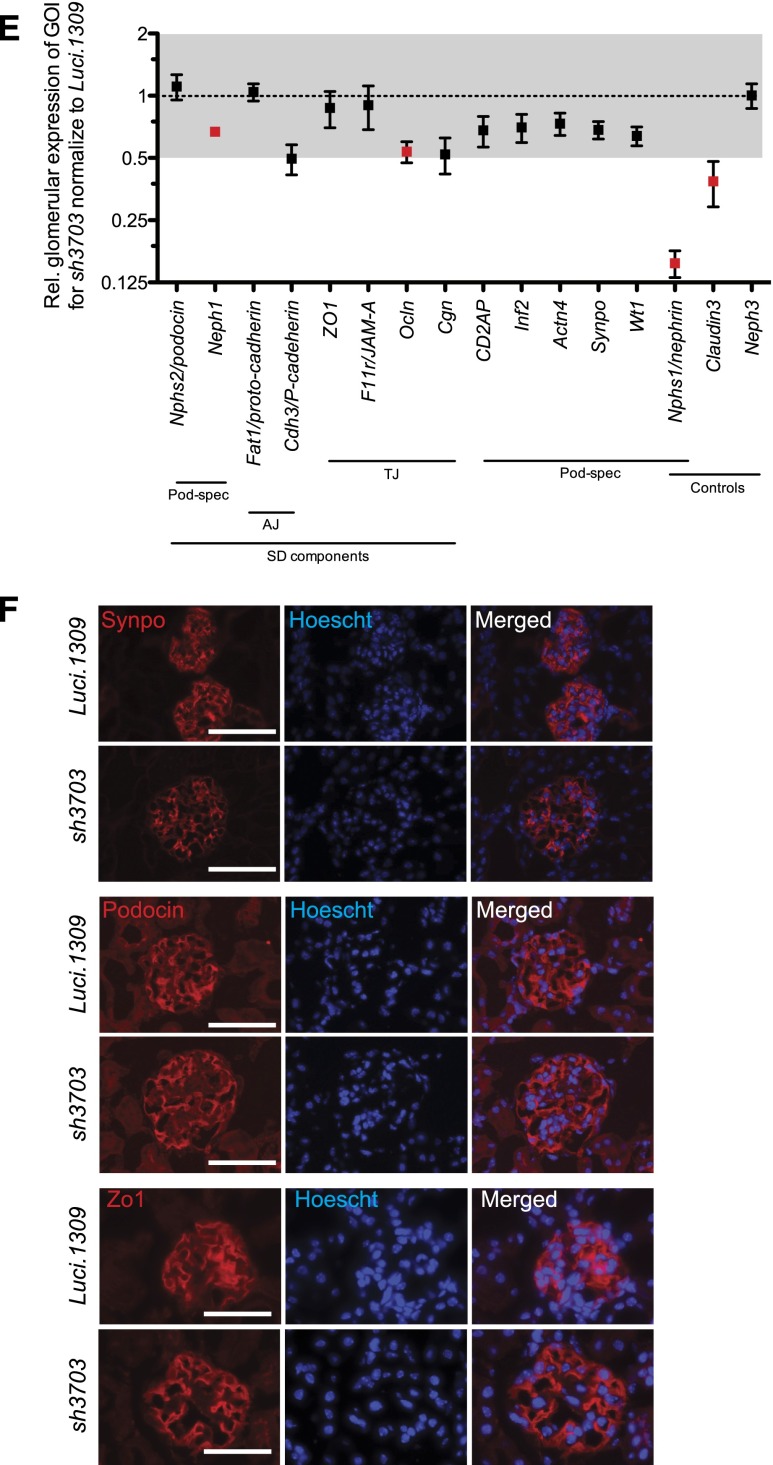
Long-term nephrin depletion disrupts all components of the glomerular tuft. Glomerular histology and ultrastructure of mice with and without nephrin knockdown. (A) Representative images of period acid-Schiff–stained kidney sections of sh3703 and Luci.1309 mice after 0, 3, 6, and 20 weeks of DOX induction. (B) Graph of glomerular cross-sectional area (μm2) for Luci.1309 and sh3703 mice after 0, 3, 6, and 20 weeks of DOX feeding (5055±150 μm2 for Luci.1309_20w versus 7214±250 μm2 for sh3703_20w; **P<0.001). (C) Representative images of transmission electron microscopy for Luci.1309 and sh3703 after 6 and 20 weeks of induction. Slit diaphragms (arrows) are present in filtration slits of Luci.1309 and sh3703 mice after 6 and 20 weeks of induction. Widening of the subendothelial zone of the glomerular basement membrane (arrowheads) occupied by amorphous extracellular matrix material is observed. (D) Graph of the FP widths of indicated mice. **P<0.01; n=3 mice for Luci.1309 and sh3703 after 6 weeks of induction; n=3 mice for Luci.1309 after 6 weeks of induction; n=4 mice for sh3703 after 20 weeks of induction. (E) Relative glomerular expression of genes that encode for slit diaphragm components and podocyte-specific genes in sh3703 mice compared with Luci.1309 mice after 20 weeks of induction. Black squares, genes not statistically different between sh3703 and Luci.1309 mice. Red squares: genes statistically different between sh3703 and Luci.1309 mice. GOI, genes of interest. n=3 Luci.1309 mice and n=5 sh3703 mice. None of the genes examined were different by more than 2-fold. (F) Representative images of immunostaining for synaptopodin (Synpo) and podocin on frozen kidneys sections of mice after 20 weeks of induction. Scale bar, 50 μm. Error bars, SEM.


