Figure 7.
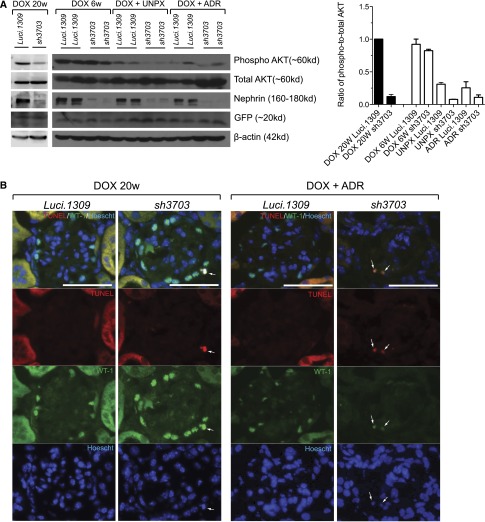
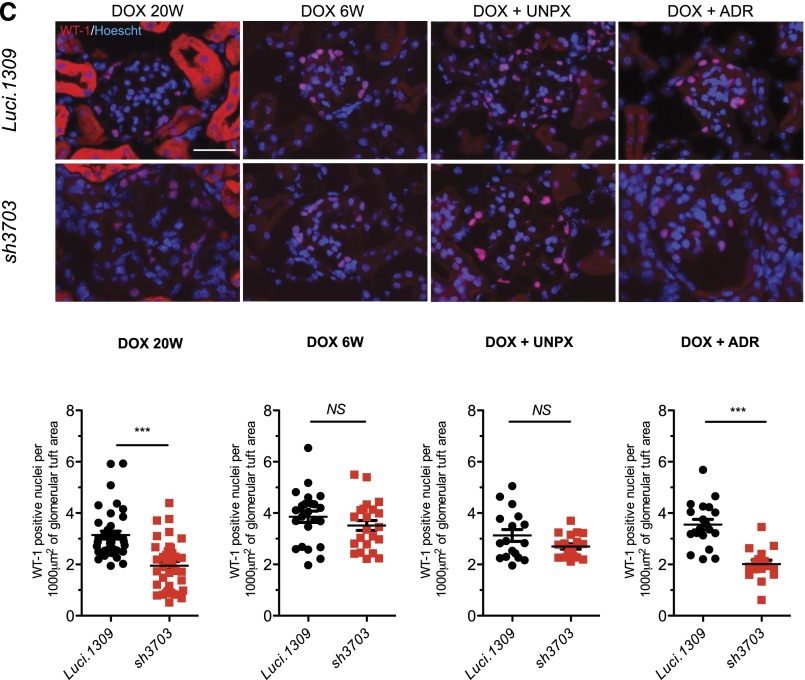
AKT signaling and podocyte viability are impaired in nephrin knockdown mice. AKT phosphorylation, apoptosis, and glomerular density of podocytes in mice with nephrin knockdown. (A) Representative Western blots of glomerular lysates from indicated mice for phospho-AKT (Ser473), total AKT, nephrin, and β-actin. After 20 weeks of DOX induction (DOX 20w), AKT phosphorylation was markedly reduced in sh3703 mice compared with Luci.1309, but not after 6 weeks of DOX induction (DOX 6w). AKT phosphorylation was markedly reduced in the remnant kidney of Luci.1309 mice with UNPX and further reduced in the remnant kidney of sh3703 mice with UNPX compared with Luci.1309 mice without UNPX. AKT phosphorylation was also reduced in doxorubicin-treated Luci.1309 mice and further reduced in doxorubicin-treated sh3703 mice. Bar graph shows the normalized ratio of phospho-to-total AKT band density plotted for each of the indicated group of mice. (B) Representative images of kidney sections from the indicated mice labeled with an antibody against WT-1 to identify podocytes as well as TUNEL for apoptotic nuclei. Glomerular cells with colabeling of WT-1 and TUNEL were detected in kidneys of sh3703 mice after 20 weeks of DOX induction (DOX 20w) and doxorubicin-injected sh3703 mice induced with DOX. Arrows indicate cells with colocalization of the Hoescht nuclear stain, TUNEL, and WT-1. Scale bar, 50 μm. (C) Representative images of kidney sections stained with WT-1. Bar graphs below represent quantification of the density of WT-1–labeled cells per glomerular tuft area (cells/1000 μm2). The density of WT-1 cells was significantly reduced for sh3703 mice after 20 weeks of DOX induction (DOX 20w) as well as doxorubicin-injected sh3703 compared with their corresponding matched control Luci.1309 mice. ***P<0.001. Error bars, SEM. NS, not significant.


