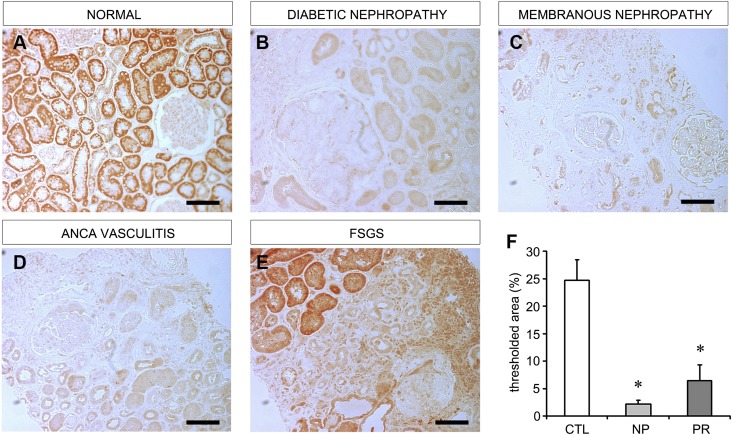
Figure 10.
EC-SOD levels are decreased in human CKD tissue biopsies. Immunohistochemistry for human EC-SOD is performed on normal control tissues as well as renal biopsy specimens from patients with CKD. (A) Normal renal tissue showing abundant EC-SOD staining (red color). (B and C) EC-SOD staining is markedly decreased in proteinuric CKD due to diabetic and membranous nephropathy. Note the complete absence of staining in fibrotic areas. (D) EC-SOD staining is also diminished in nonproteinuric CKD due to c-ANCA vasculitis. (E) Areas of transition from normal tissue to fibrotic tissue are identified and show strong staining in normal tubules and absence of staining in fibrotic/diseased areas. (F) Quantitation of EC-SOD expressed as percent of total tissue area with positive EC-SOD staining (control tissue, n=3; nonproteinuric CKD, n=5; proteinuric CKD, n=9). CTL, control; NP, nonproteinuric CKD; PR, proteinuric CKD. Bar, 100 μm.

