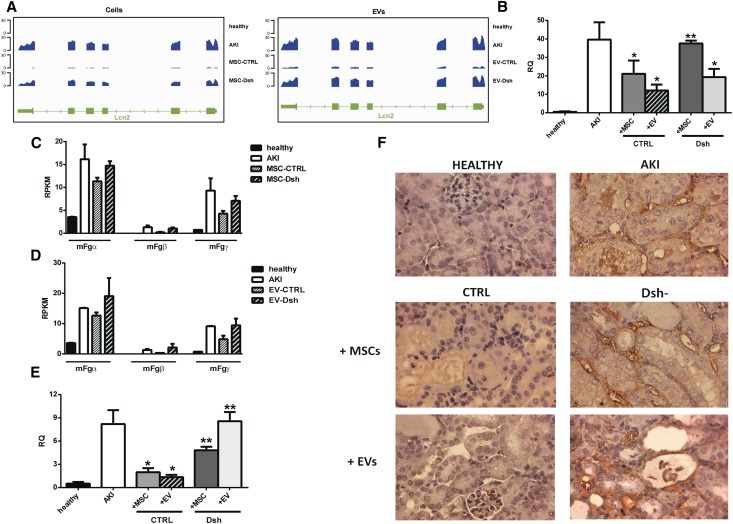
Figure 7.
MSC and EV-Dsh injected mice maintained elevated levels of AKI markers. (A) Representative genomic occupancy profile of the Lcn2 gene among healthy, untreated AKI, MSC-treated AKI (left panel), or EV-treated AKI (right panel). (B) qRT-PCR confirmation of Lcn2 modulation in mice after MSC and EV treatments with respect to untreated AKI mice (n=6 mice per group). Healthy mice are used as negative controls. (C and D) Expression levels of the three Fg subunits detected by RNA-Seq analysis among healthy, untreated AKI, (C) MSC-treated AKI, or (D) EV-treated AKI mice. (E) qRT-PCR confirmation of Fg-β expression in mice after MSC and EV treatments with respect to untreated AKI mice (n=6 mice per group). In healthy mice, no or minimal expression of all of the Fg subunits was observed. (F) Immunohistochemistry analysis of Fg-β among healthy, untreated AKI, MSC-treated, and EV-treated animals. Tubular staining was not observed in kidneys from healthy mice and was markedly reduced in mice treated with MSC-CTRL and EV-CTRL. On the contrary, AKI untreated, MSC-Dsh–treated, and EV-Dsh–treated animals showed a strong peritubular staining and some cytoplasmic tubular staining. For qRT-PCR analysis, data are expressed as means ± SDs; ANOVA with Newman–Keuls multicomparison test. *P<0.05 versus AKI; **P<0.05 versus CTRL.

