
Figure 2.
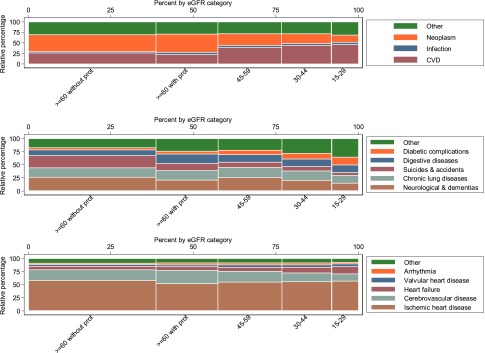
Unadjusted relative percentages for death by cause and eGFR. Top panel shows the relative percentages for death by eGFR category for each of the four main categories: CVD, neoplasm, infection, and other. The most common cause of death for those with eGFR>60 ml/min per 1.73 m2 and no proteinuria was cancer. The most common cause of death for those with eGFR<60ml/min per 1.73m2 was cardiovascular disease. Middle panel shows the relative percentages for death by eGFR category for the subclassification of other causes from top panel. Among participants without proteinuria and eGFR>60 ml/min per 1.73 m2, neurologic diseases (including dementia) were the most common cause of death. At lower eGFR, the proportions of death caused by unclassified and diabetic complications increased. Bottom panel shows the relative percentages for death by eGFR category for the subclassification of CVD deaths. For participants with eGFR>60 ml/min, death caused by ischemic heart disease (IHD) was the most common cause of cardiovascular death. The proportion of deaths caused by heart failure and valvular disease increased at lower eGFR. The height of each colored bar represents the percentage of participants for each cause of death within each category of eGFR. The width of each colored bar represents the percentage of participants for each eGFR category within each cause of death. The area of each colored bar represents the percentage of participants within each eGFR category and each cause of death. Prot, proteinuria.