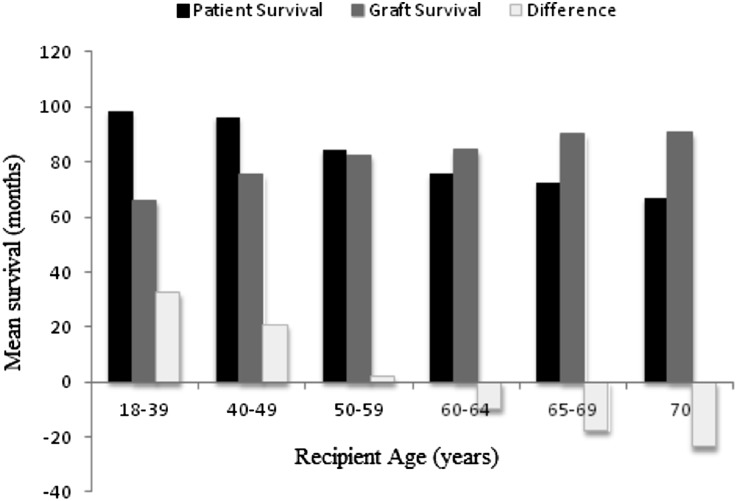
Figure 4.
Ten-year mean patient and death-censored allograft survival and difference between curves (in months) after transplantation from a deceased donor aged ≥65 years in the United States. Positive values for the difference (white bars) indicate average patient survival was greater than death-censored allograft survival, whereas negative values indicate death-censored allograft survival was greater then patient survival.

