


Fig. 2.
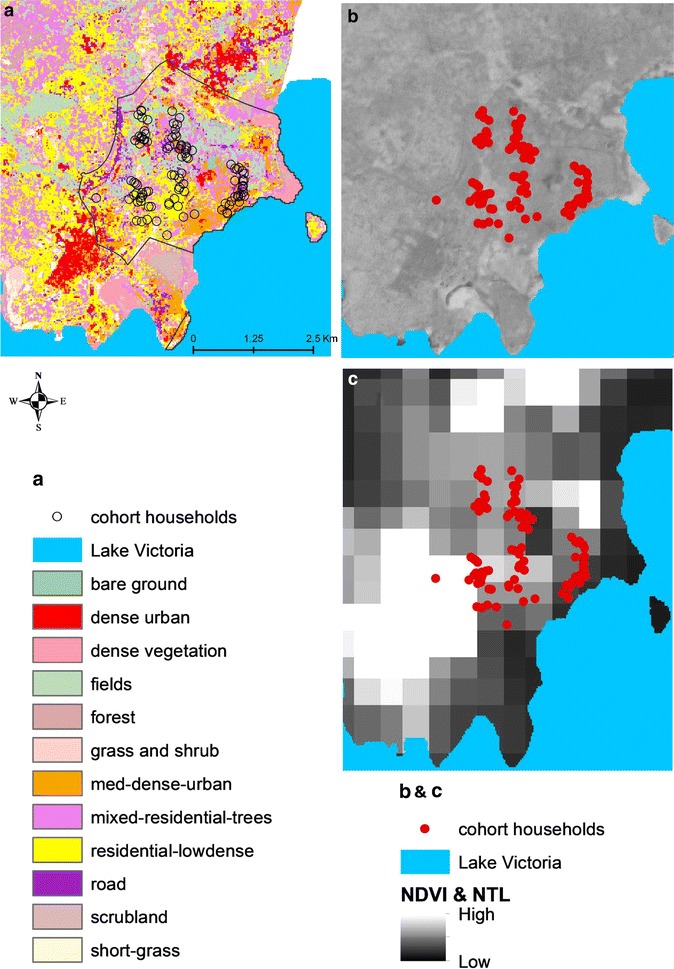
Distribution of three urbanicity metrics across the three sites, based on the frequency distribution of individual metric values within a 100 m buffer around households participating in the cohort and entomology study in each site. a Land cover classification in Walukuba at 30 m spatial resolution overlaid with the participating study households. b NDVI in Walukuba at 6 m spatial resolution. c Satellite-derived night-time light brightness across Walukuba overlaid with the participating study households