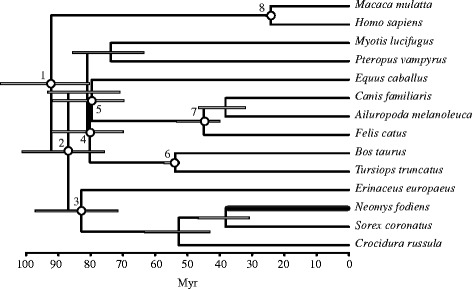
Fig. 4.

Bayesian relaxed clock tree reconstructed with mammalian intron sequences. Calibration nodes are shown with a white circle. The taxa corresponding to these nodes and the corresponding minimum and maximum constraints, in Myr, are: Boreoeutheria (1): 61.50 and 131.50; Laurasiatheria (2): 62.50 and 131.50; Eulipotyphla (3): 61.50 and 131.50; Ferungulata (4): 62.50 and 131.50; Zooamata (5): 62.50 and 131.50; Cetartiodactyla (6): 52.40 and 65.80; Carnivora (7): 39.68 and 65.80; and Catarrhini (8): 23.5 and 34.00. The Neomys fodiens branch from which mutation rates were estimated is shown with a thicker line
