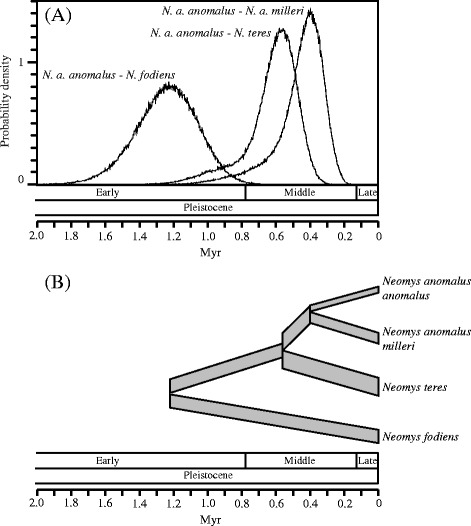
Fig. 5.

a Posterior probability density distributions for split time parameters corresponding to the isolation-with-migration model in IMa2. The X-axis was scaled with the geometric mean of the mutation rates to reflect time in Myr. The limits of the major ages of the Pleistocene are shown [69]. b Species tree of the Neomys lineages with split times and effective population sizes estimated by IMa2. The widths of the different population segments are proportional to the estimated effective population sizes. The X-axis is at the same scale than in (a)
