
Fig. 4.
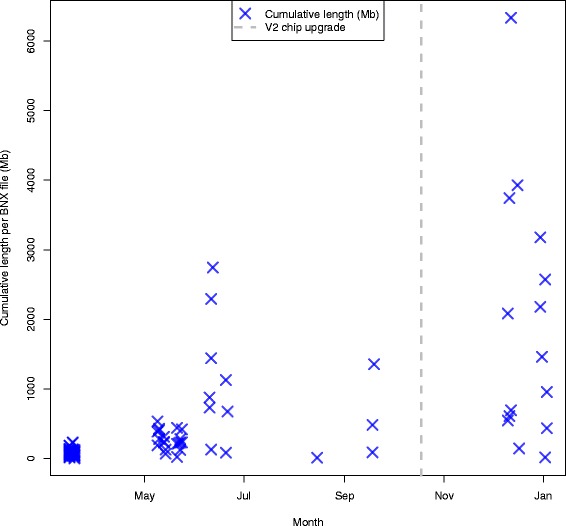
Cumulative length per BNX file for T. castaneum data generated over time. Cumulative length of single molecule maps > 150 kb are plotted on the y-axis (purple X), the upgrade to the V2 IrysChip (grey dashed line) is plotted and date is indicated on the x-axis. Data was generated from 03-2013 to 01-2014. Aborted runs (cumulative length = 0) excluded