
Fig. 9.
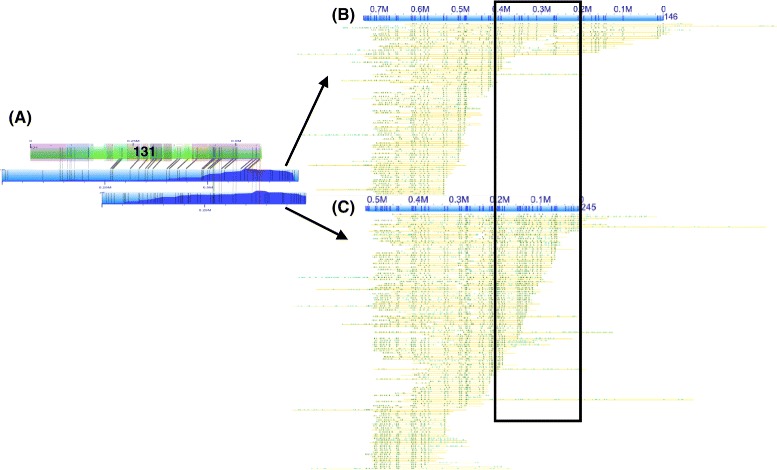
Putative haplotypes assembled as consensus genome maps. a Two consensus genome maps (blue with molecule map coverage shown in dark blue) align to the in silico map of scaffold 131 (green with contigs overlaid as translucent colored squares). b and c Both consensus genome maps are shown (blue) with single molecule pileups (yellow). Both consensus genome maps have similar label patterns except within the lower coverage region indicated with a black square