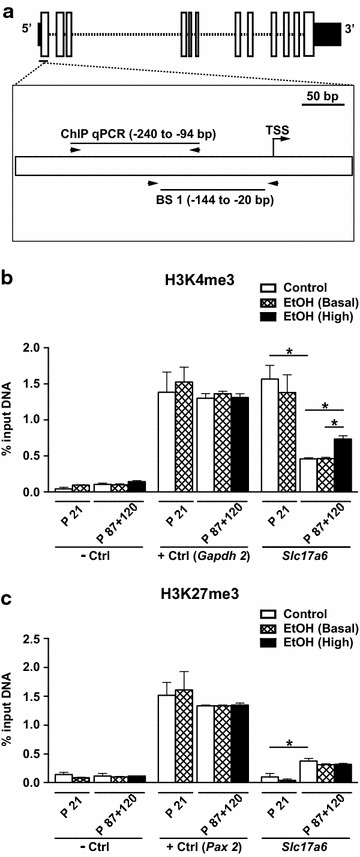
Fig. 3.

Analysis of H3K4me3 and H3K27me3 at Slc17a6. a Schematic representation of the Slc17a6 gene showing the region assayed by ChIP-qPCR (−240 to −94 bp) relative to BS1 and the TSS is shown. Horizontal arrows represent PCR primers. b H3K4me3 in the male hippocampus at P21 and P87 + 120 (n = 12 mice/group, pooled). A gene desert and Gapdh2 were used as a negative control (−Ctrl) and positive control (+Ctrl), respectively. c H3K27me3 in the male hippocampus at P21 and P87 + 120 (n = 12 mice/group, pooled). A gene desert and Pax2 were used as negative and positive controls, respectively. Data are shown as mean and standard deviation. *P < 0.05 (t test, two-tailed)
