
Fig 1.
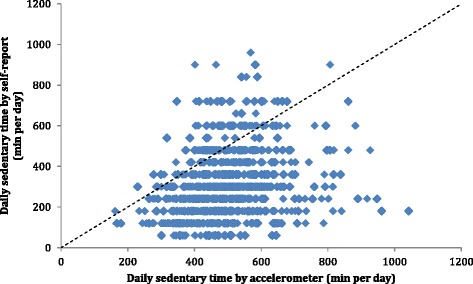
Scatterplot for objectively measured (accelerometry) and self-reported time spent sedentary by question E. The line of identity is plotted in the figure. Spearman’s rho was 0.30 (p <0.001)
Official websites use .gov
A
.gov website belongs to an official
government organization in the United States.
Secure .gov websites use HTTPS
A lock (
) or https:// means you've safely
connected to the .gov website. Share sensitive
information only on official, secure websites.
Scatterplot for objectively measured (accelerometry) and self-reported time spent sedentary by question E. The line of identity is plotted in the figure. Spearman’s rho was 0.30 (p <0.001)