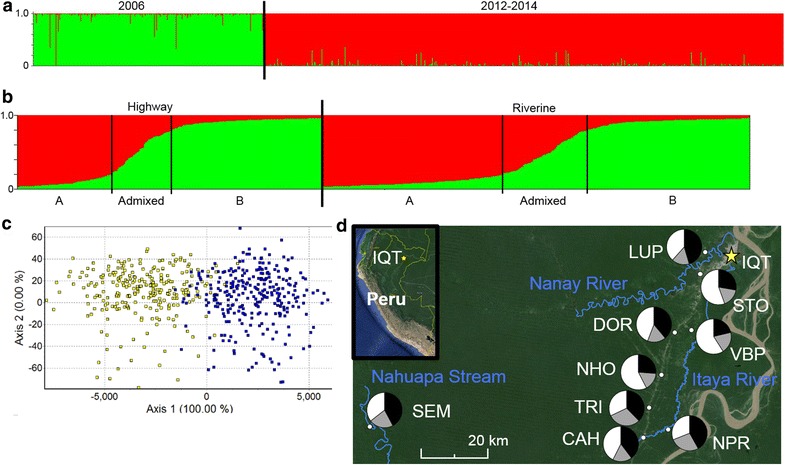
Fig. 4.

Population structure of Anopheles darlingi. a Results from the population structure analysis of mosquitoes from 2006 and 2012–2014 peri-Iquitos, Loreto, Peru collections, using 13 microsatellite loci. Optimal K = 2. b Results from the population structure analysis of mosquitoes collected in the current study, using 13 microsatellite loci. Optimal K = 2. Individuals within each habitat were sorted by subpopulation membership. Vertical bars within Highway and Riverine sections indicate cutoffs for membership to each subpopulation based on a threshold value of 0.8. Statistically significant differences in distribution of subpopulations by habitat (, p < 0.005). c Factorial Correspondence Analysis comparing subpopulations (13 microsatellite loci): yellow subpopulation A, blue subpopulation B. Axis 1 explains 100 % of the inertia in individual An. darlingi genotypes. d Map of the area surrounding Iquitos, Loreto, Peru (yellow star), depicting An. darlingi collection sites in this study (small white circles). The pie charts on the map, placed near the localities they represent, are the proportion of An. darlingi per detected subpopulation. Two subpopulations were detected in the current study (black subpopulation A, white subpopulation B, grey admixed). The Iquitos-Nauta highway can be seen in the satellite image, extending southwesterly from Iquitos. The Amazon river can be seen along the right-hand edge of the map
