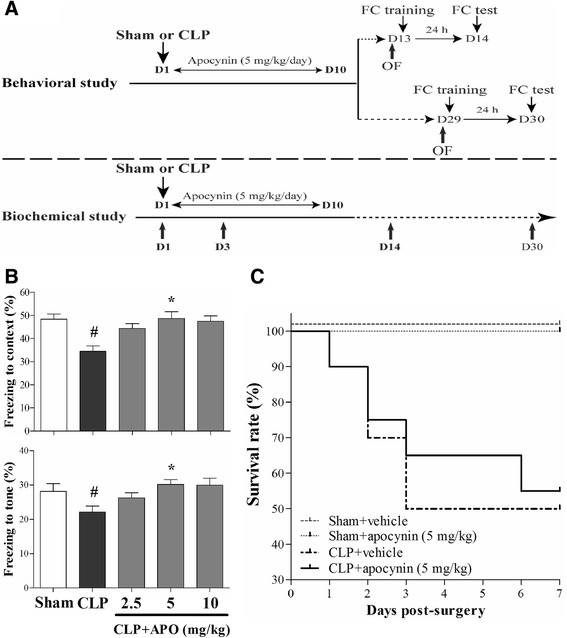
Fig. 1.

a Schematic timeline of the experimental procedures. b Dose-response of apocynin on the fear conditioning test in mice. Data are presented as mean ± SEM (n = 10–12). # p < 0.05 vs the sham group; *p < 0.05 vs the CLP group. c Apocynin treatment did not affect the survival rate of the sepsis mice (n = 12–20)
