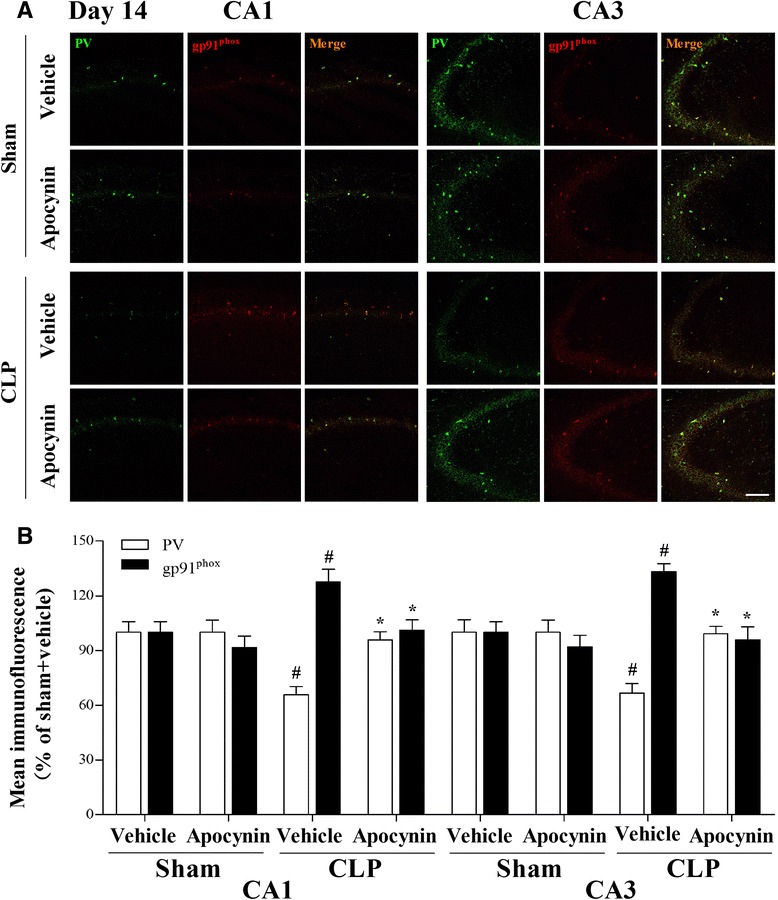
Fig. 8.

Double-immunofluorescence staining to detect co-localization of PV and gp91phox in the CA1 and CA3 regions of the hippocampus at day 14 after operation. a Representative images of PV (green) and gp91phox (red) in the CA1 and CA3 regions of the hippocampus. b The PV immunoreactivity was decreased and the gp91phox immunoreactivity was increased in the PV interneurons in the CA1 and CA3 regions of the hippocampus in the CLP + vehicle group compared with the sham groups, whereas apocynin treatment reversed these abnormities. Data are presented as mean ± SEM (n = 6). # p < 0.05 vs the sham groups; *p < 0.05 vs the CLP + vehicle group. Scale bar = 100 μm
