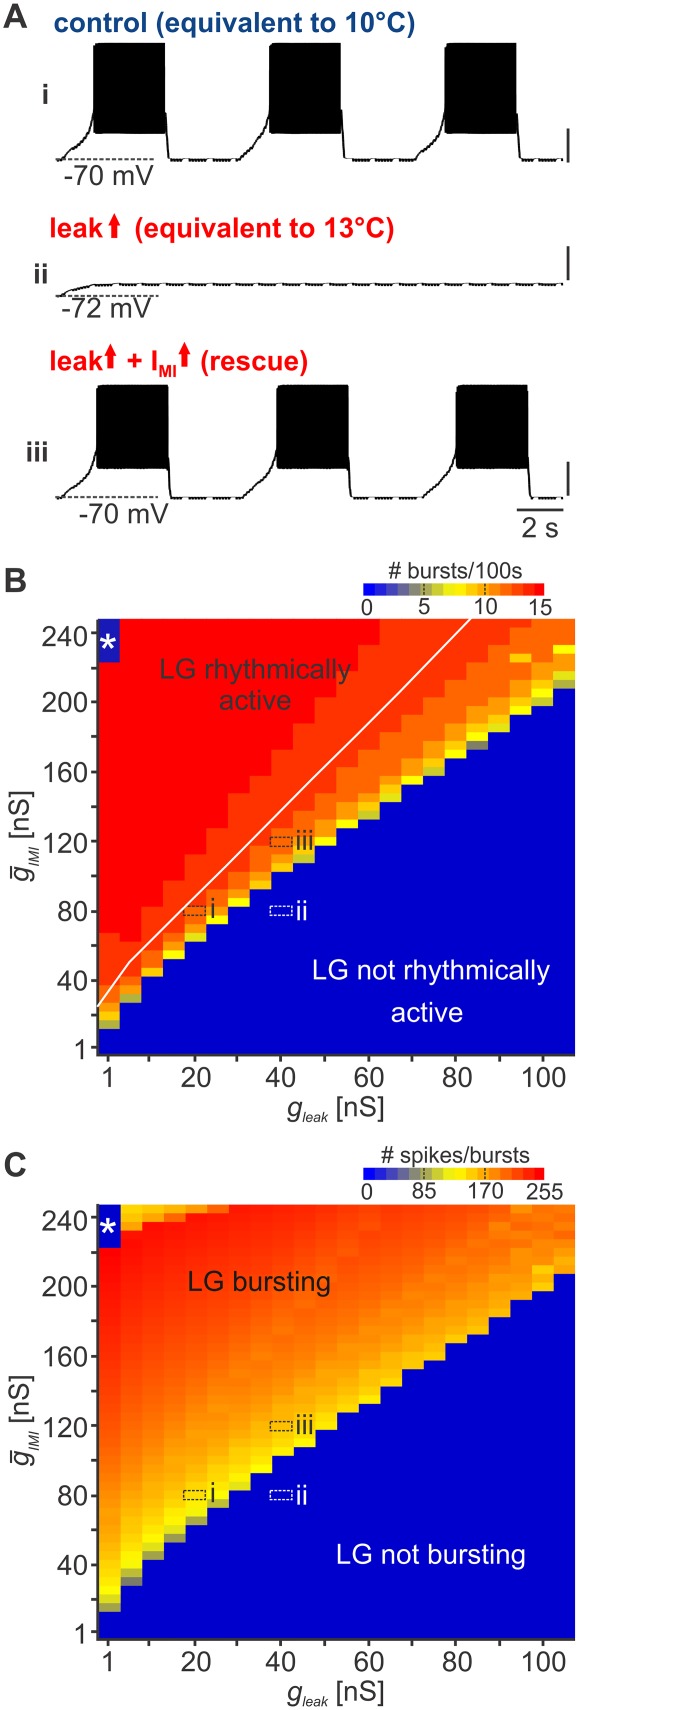
Fig 8. IMI counterbalances leak conductance to rescue neural oscillations in a computational model.
(A) Model output of LG membrane potential at (i) low leak and IMI conductance (g leak = 20 nS, ), (ii) increased leak (g leak = 40 nS, ), and (iii) increased IMI (g leak = 40 nS, ). Vertical scale bars, 20 mV. (B) Color map of number of bursts occurring in 100 s for 1,100 simulations as a function of leak and IMI conductances. Warmer colors represent more bursts;* highlights areas with one burst. (C) Color map of the number of LG spikes/100 s for 1,100 simulations as a function of leak and IMI conductances. Warmer colors represent more LG spikes. (B–C) Labeled areas (i–iii) indicate parameter sets corresponding to the traces shown in A.

