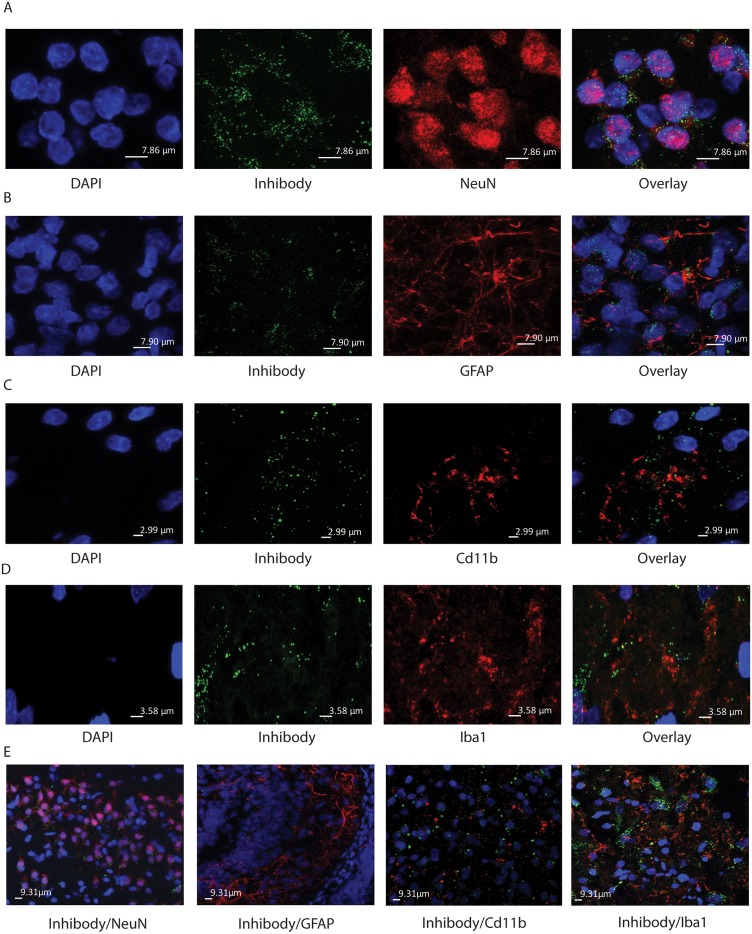
Fig 5. Presence of active GBA in neurons.
Shown is zooming (3×) of 63× confocal images in A-C. (A) SN of i.c.v. infused rats with MDW933. From left to right images of DAPI, green MDW933, red NeuN antibody staining and overlay image. The overlay shows the Inhibody label around NeuN positive nuclei of neuronal cell suggesting lysosomal localization. (B) Median Eminence (ME) of i.c.v. infused rats with MDW933. From left to right images of DAPI, green MDW933, red GFAP antibody and overlay image. The overlay shows GFAP positive cells with concomitant Inhibody labeling. (C) SN of i.c.v. infused rats with MDW933. From left to right images of DAPI, green MDW933, red CD11b antibody and overlay image. The overlay shows MDW933 signal in areas containing microglia cells. (D) SN of i.c.v. infused rats with MDW933. From left to right images of DAPI, green MDW933, red Iba1 antibody and overlay image. The overlay shows MDW933 signal in areas containing microglia cells. (E) 63x confocal images of the SN and ME of i.c.v. infused rats with MDW933. The images show from left to right green MDW933 and red NeuN antibody (SN); green Inhibody and red GFAP antibody (ME); green Inhibody and red CD11b antibody (SN); green Inhibody and red Iba1 antibody (SN).

