
Fig. 4.
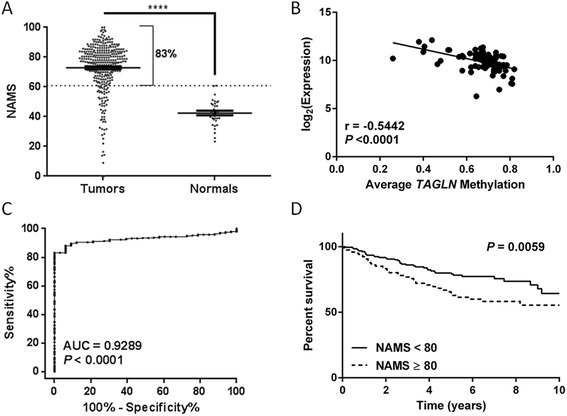
Methylation status of TAGLN in public datasets GSE20713 and GSE31979. a Graphs showing higher normalized average methylation scores (NAMS) for two probes of TAGLN in tumor tissues Mann–Whitney test, ****P < 0.0001. Horizontal lines: mean ± SEM. b Scatter plot showing correlation of average methylation scores of TAGLN probes (GSE20713) to average expression (log2) of TAGLN probe sets (GSE20711); Spearman r = −0.5442, P < 0.0001. c ROC analyses for discrimination between healthy individuals and breast cancer patients, using TAGLN NAMSs. d Kaplan-Meier (KM) survival analysis showing higher RFS percentages for patients with tumor TAGLN NAMSs ≤80 (best cutoff among tested)