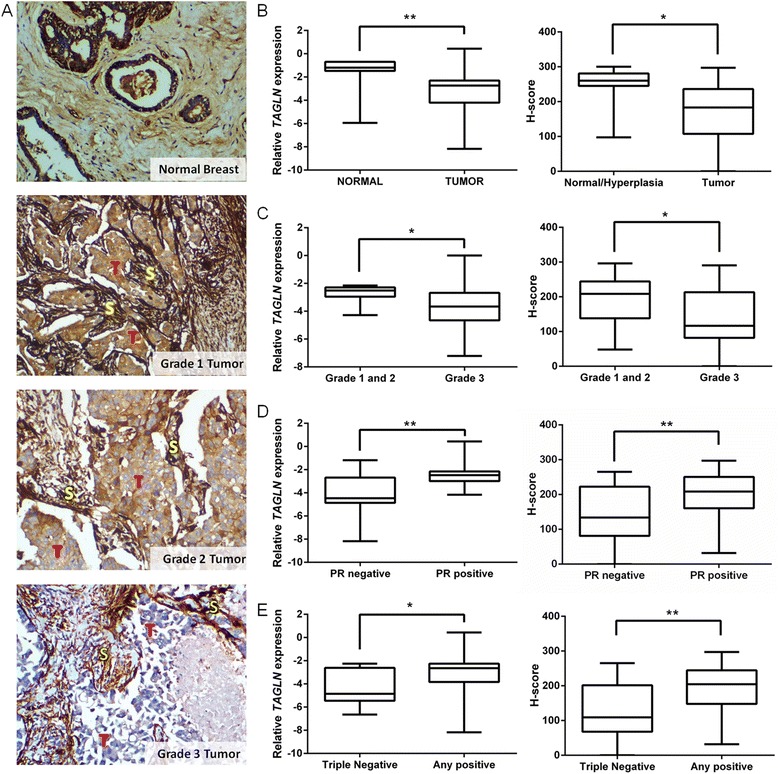
Fig. 5.

TAGLN expression in independent sets of tumor and normal breast tissues. a Examples of IHC staining of TAGLN in normal and tumor tissues. T (red), tumor tissue; S (yellow), stroma, ×100 magnification. b–e Box-plot analyses showing significant downregulation of TAGLN mRNA (left) and protein (right) expression levels in tumors compared to normal breast tissues (b); in grade 3 compared to grade 1 and 2 tumors (c); progesterone receptor (PR) negative compared to positive subtypes (d); and in triple negative compared to any hormone receptor positive (ER and/or PR and/or Her2 positive, Any positive) tumors (e). Horizontal lines: maximum, median, and minimum values. Left panels: qRT-PCR analysis of TAGLN mRNA expression levels (log2 transformed) in a cDNA array (n = 7 normal, n = 41 tumor tissues) relative to geometric means of ACTB and SDHA mRNA reference genes. Right panels: IHC staining of TAGLN protein in a tissue array (n = 67 tumor, n = 7 normal tissues). H-score method was used for staining intensity calculation. *P < 0.05, **P < 0.01, Mann–Whitney Test
