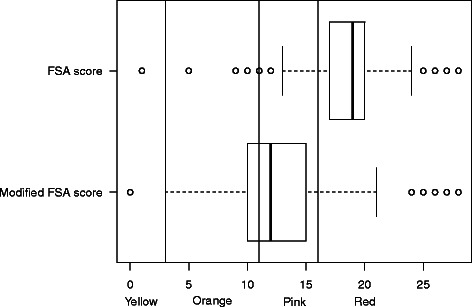
Fig. 5.

Boxplot of the distribution of added fats in the original and modified FSA score. Vertical lines represent the cut-offs of the 5-CNL categories. The boundary of the box nearest to the right indicates the 25th percentile, the line within the box marks the median, and the boundary of the box furthest from the right indicates the 75th percentile. Whiskers (error bars) above and below the box indicate the lower limit (25th percentile – 1.5 * (Inter-quartile range) and the upper limit (75th percentile + 1.5 * (Inter-quartile range)). The circles are individual outlier points
