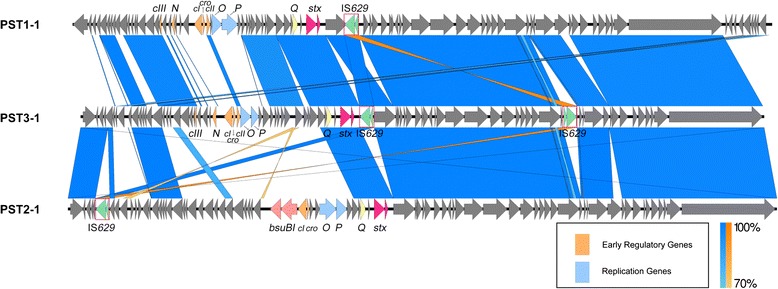
Fig. 3.

The three PST clusters differ mainly in the early regulatory and replication regions. BLAST comparisons of phage genomes were visualized using Easyfig [77]. Blue shaded regions connect homologous sequences and orange shaded regions connect reverse complemented homologous sequences. Arrows represent ORFs. Light orange, light blue and light yellow arrows represent early regulatory genes, replication genes and antiterminator Q, respectively. Light pink arrows represent bsuBI restriction/modification system. Dark pink and green arrows designate the location of stx2 and IS629, respectively
