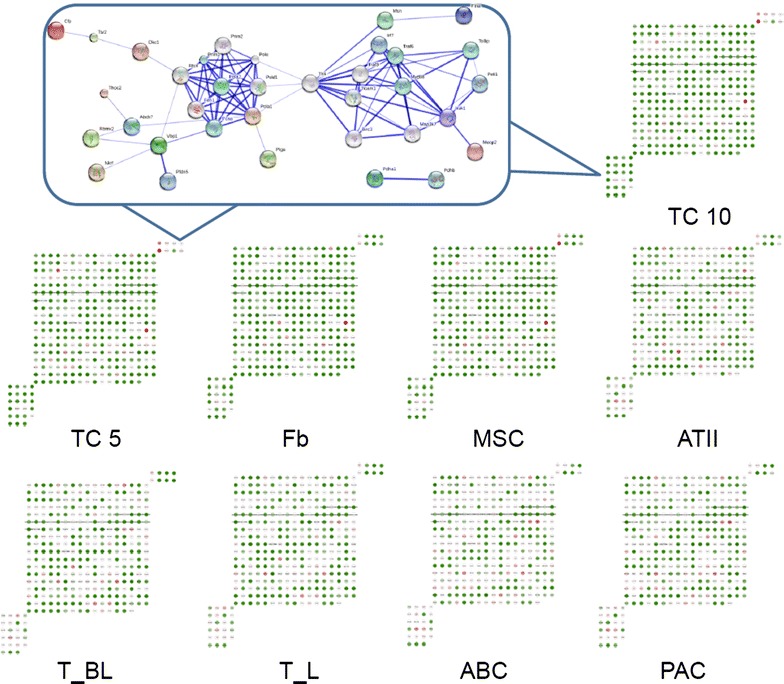
Fig. 3.

Expression profiles of TC-specific or dominant genes. Expression profiles of the up- or down-regulated genes (more than one fold) in both TC5 and TC10 as compared with MSCs, Fbs, ATII, ABCs, PACs, T-BL and T-L. The profiles for entire genes are described in Additional file 1. The selected core network and whole mouse network are linked by the documented functional interactions from various databases (see “Methods”). Genes in each network are indicated in red and some of their nearest neighbors are indicated by grey nodes. The 8 up-regulated genes in TCs were shown in the upper right corner, while the 23 down-regulated genes in the lower left and their distribution in each type of cells showed in Fig. 2b. These up- or down-regulated genes were considered as TC-specific or TC-dominant genes. The connections between these genes were analyzed and illustrated
