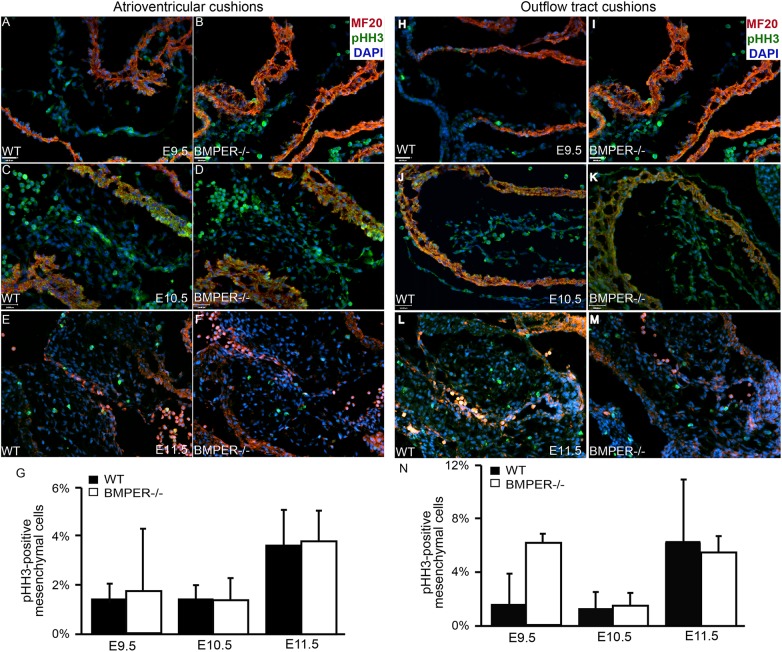
Fig 3. Proliferation is normal in the BMPER-/- cushions.
Proliferation was assessed in the atrioventricular cushions (AVCs) and outflow tract (OFT) cushions. Proliferative cells were detected via phosphohistone H3 expression (green), and sagittal sections were colabeled with the myocardial marker MF20 (red) and nuclear marker DAPI (blue). For each sample, all mesenchymal cells in at least 3 sections or a minimum of 100 cells were counted. (A-G) Wild-type (A, C, E) and BMPER-/- (B, D, F) AVCs were evaluated at E9.5 (A, B), E10.5 (C, D), and E11.5 (E, F). (A, B) At E9.5, no significant differences were observed between genotypes. (C, D) By E10.5, the proliferation remained similar in both the BMPER-/- and wild-type AVCs. (E, F) By E11.5, the proliferation rate increased similarly in both genotypes. (G) The proliferation rates for each group were quantified. n = 2, 4, and 3 for wild-type AVCs and 2, 5, and 3 for BMPER-/- AVCs at E9.5, E10.5, and E11.5, respectively. (H-N) Wild-type and BMPER-/- OFT cushions were evaluated in the same manner. (H, I) At E9.5, proliferation was increased, though not significantly, in the OFT cushions of BMPER-/- embryos compared with wild-type embryos. (J, K) By E10.5, the proliferation rate decreased in the BMPER-/- OFT cushions and was comparable to that in the wild-type OFT cushions. (L, M) As EMT ended and the OFT cushions entered the proliferative phase, the proliferation rate increased similarly in both genotypes. (N) The proliferation rates for each group were quantified. n = 2, 4, and 3 for wild-type OFT cushions and 2, 5, and 3 for BMPER-/- OFT cushions at E9.5, E10.5, and E11.5, respectively. Scale bars in A, B, H, and I = 100 μm; scale bars in C, D, J, and K = 110 μm and apply to E, F, L, and M.

