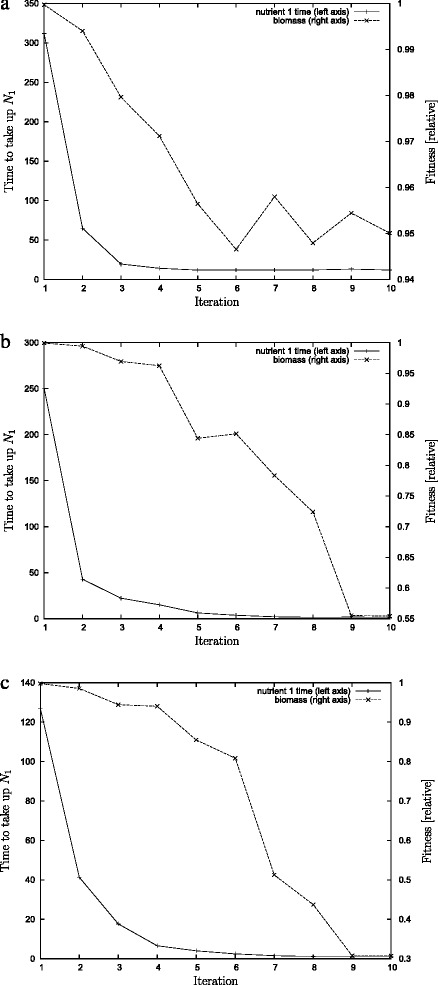
Fig. 5.

The time when nutrient 1 is used up (left axis) and the biomass produced after 500 time units (right axis). The graph shows simulations against a dummy incumbent. The time to take up nutrient 1 falls quickly during the first few iterations and then approaches a limit. a In the case of extremely limited space total growth falls marginally only to about 95 %, whereas there are more significant drops in the case (b) of moderate limitation where the efficieny falls to nearly 55 % and (c) in the case of no limitation where the efficiency falls to about 35 %. These graphs report the results from individual evolutionary runs
