Fig. 7.

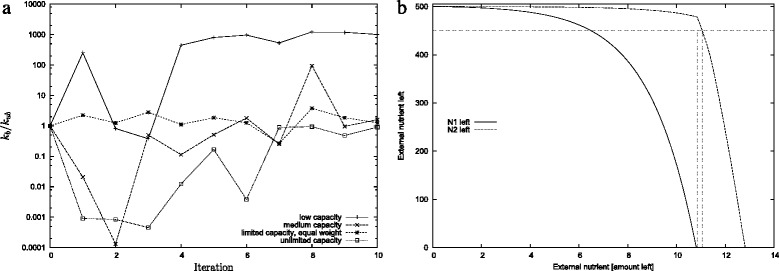
a The ratio k b/k ub averaged over six different evolutionary runs. The parameter k b determines how strongly repressors bind to the porins for nutrient; similarly k ub determines how strongly the repressor-porin complex dissociates. Hence, the ratio is an indicator of how strongly the system represses uptake of N 2 in the presence of external N 1. A low value would indicate a weaker regulation than a high value. Note the logscale on the vertical axis. b The remaining external nutrient N 1 and N 2 as a function of time using an example parameter set where sequential uptake has evolved. The horizontal line indicates the value 450. The vertical line indicates the point where N 1 is exhausted and where N 2 crosses 450. The time difference between the two horizontal lines is the switching delay (i.e. Eq. 2)
