
Fig. 2.
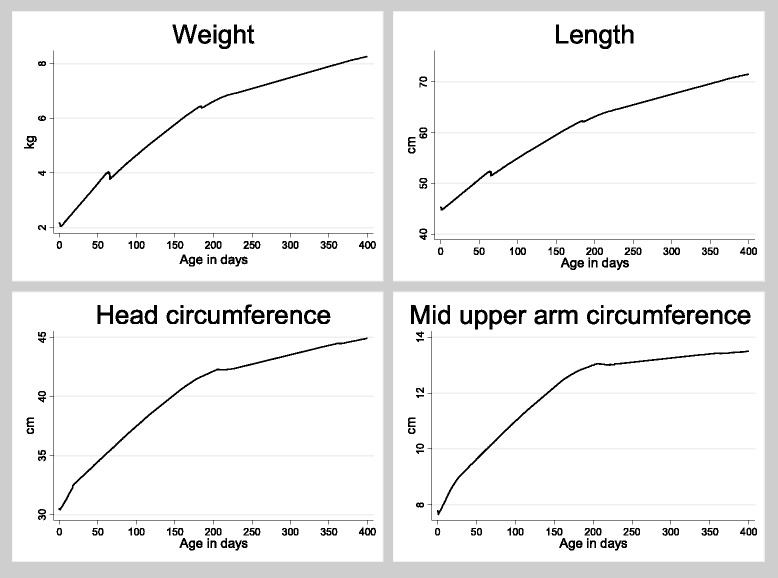
Lowess curves illustrating patters of growth for weight, length, head circumference and mid upper arm circumference (MUAC). The lowess curves are generated for both the early BCG group and the late BCG group together. There is no effect of BCG on the overall estimates why the lines for the two randomization groups could not be drawn separately