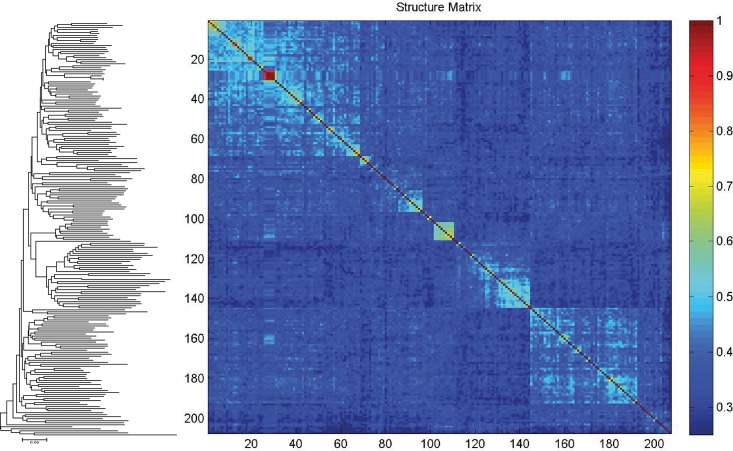
Fig 5. Klee diagram of the analyzed crustacean species.
The image was generated from a TreeParser-ordered alignment with a correlation scale presented at the right of the diagram. Sequence clusters appear as blocks of higher correlation along the diagonal, on the left a corresponding NJ topology in identical order (see S3 Fig for details).

