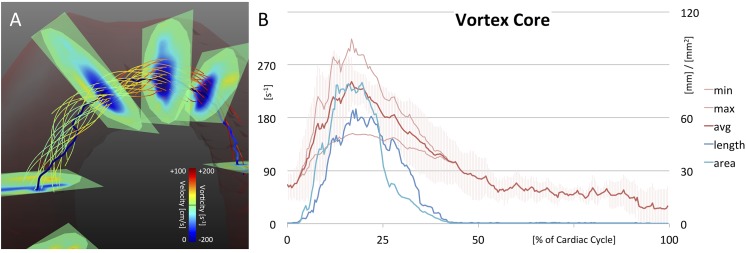
Fig 7. 3D Quantification.

(A) The resulting vortex core of one healthy subject. The core line is passing through points of minimum λ2. Note flow rotating around the core line. (B) Results of quantitative vortex core analysis, representing the vortex’s strength, elongation, and radial expansion (averaged over all healthy subjects). Underlying data of the diagram can be found in S3 Data.
