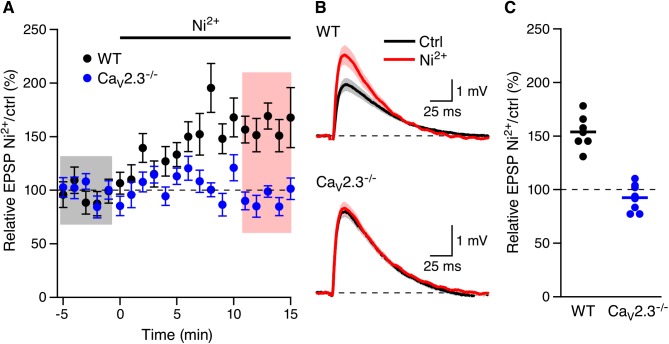
Fig 4. Boosting of EPSPs by Ni2+ requires CaV2.3 R-type Ca2+ channels.
(A) Time course of the normalized EPSP amplitude (mean ± s.e.m.) for baseline in control aCSF (Ctrl) and during wash-in of 100 μM Ni2+ in WT (black symbols, n = 7) and CaV2.3-/- mice (blue symbols, 8). (B) Average of 15 EPSPs taken from indicated shaded time points in aCSF (black) and 16–20 min after application of Ni2+ (red); shaded areas are mean ± s.e.m. (C) Scatter plot of relative ESPS peak compared to baseline (Ctrl) from the individual slices in panel A for CaV2.3-/- (blue symbols) and WT (black symbols). Horizontal bar reflects mean response.

