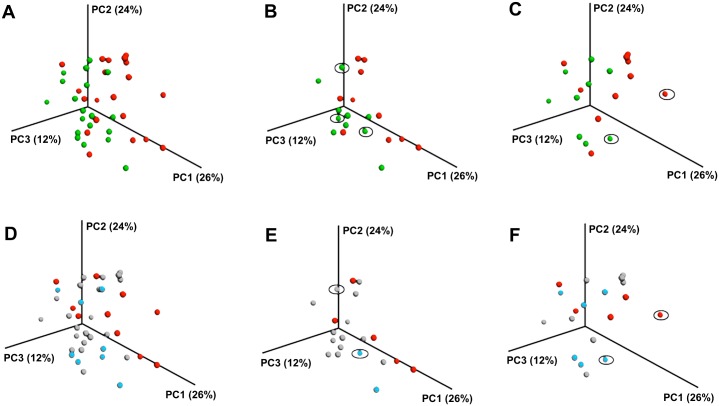
Fig 2. Principal Coordinate Analysis of bacterial communities in One-Year samples of dental plaque from children by plaque urease activity and caries status.
Figures A, B and C: samples divided by median urease activity: red- below the median (<2.16 units/mg); green- above the median (>2.16 units/mg). Figures D, E, and F: red- lowest urease quartile (<1.62 units/mg) vs. bleu- highest urease quartile (>2.86 units/mg); light gray: second and third quartile of urease (1.62–2.86 units/mg). A and D: All samples; B and E: Caries-Free (dmfs = 0); C and F: Caries-Experienced (dmfs>0). Circled samples in the Caries-Free groups belong to children who were initially caries free but developed caries within the one-year study period. In the Caries-Experienced group, the circled samples correspond to children who had previous caries but did not develop any new lesions within the one-year study period.

